Title
题目
Deep Learning-Based Classification of Hepatocellular Nodular Lesions on Whole-Slide Histopathologic Images
基于深度学习的肝细胞结节性病变在整片组织病理图像上的分类
Background
背景
Hepatocellular nodular lesions (HNLs) constitute a heterogeneous group of disorders. Differential diagnosis among these lesions, especially high-grade dysplasticnodules (HGDNs) and well-differentiated hepatocellular carci noma (WD-HCC), can be challenging, let alone biopsy speci mens. We aimed to develop a deep learning system to solve these puzzles, improving the histopathologic diagnosis of HNLs (WD-HCC, HGDN, low-grade DN, focal nodular hyperplasia,hepatocellular adenoma), and background tissues (nodularcirrhosis, normal liver tissue).
肝细胞结节性病变(HNLs)构成了一个异质性疾病群。这些病变之间的鉴别诊断,特别是高级别发育不良结节(HGDNs)与良性分化的肝细胞癌(WD-HCC),可能具有挑战性,更不用说活检样本了。我们旨在开发一个深度学习系统来解决这些难题,以提高HNLs(WD-HCC、HGDN、低级别DN、局灶性结节性增生、肝细胞腺瘤)以及背景组织(结节性肝硬化、正常肝组织)的组织病理诊断。
Conclusions
结论
We first developed a deep learning diagnostic model for HNLs, which performed well and contributed to enhancing the diagnosis rate of early HCC and risk stratification of patients with HNLs. Furthermore, HnAIM had significant ad vantages in patch-level recognition, with important diagnostic implications for fragmentary or scarce biopsy specimens.
我们首次开发了一个用于HNLs的深度学习诊断模型,该模型表现良好,并有助于提高早期HCC的诊断率和HNLs患者的风险分级。此外,HnAIM在补丁层面识别方面具有显著优势,对于零碎或稀缺的活检样本具有重要的诊断意义。
Results
结果
We obtained 213,280 patches from 1115 whole-slide images of 738 patients. An optimal model was finally chosen based on F1 score and area under the curve value, named hepatocellular-nodular artificial intelligence model (HnAIM), with the overall 7-category area under the curve of 0.935 in the independent external validation cohort. For biopsy specimens, the agreement rate with sub specialists’ majority opinion was higher for HnAIM than 9 pa thologists on both patch level and whole-slide images level.
我们从738名患者的1115张整片幻灯片图像中获得了213,280个补丁。基于F1得分和曲线下面积值,最终选择了一个最优模型,命名为肝细胞结节性人工智能模型(HnAIM),在独立外部验证队列中,7类别的曲线下面积为0.935。对于活检样本,HnAIM与亚专家多数意见的一致率高于9名病理学家,无论是在补丁层面还是整片幻灯片图像层面。
Method
方法
The samples consisting of surgical and biopsy specimens were collected from 6 hospitals. Each specimen was reviewed by 2 to 3 subspecialists. Four deep neural networks (ResNet50, InceptionV3, Xception,and the Ensemble) were used. Their performances were eval uated by confusion matrix, receiver operating characteristic curve, classification map, and heat map. The predictive efficiency of the optimal model was further verified by comparing with that of 9 pathologists.
样本包括手术和活检标本,这些标本收集自6家医院。每个标本由2至3名亚专科医生审核。使用了四个深度神经网络(ResNet50、InceptionV3、Xception和集成网络)。它们的性能通过混淆矩阵、接收者操作特征曲线、分类图和热图进行评估。通过与9名病理医生的诊断结果进行比较,进一步验证了最优模型的预测效率。
Figure
图
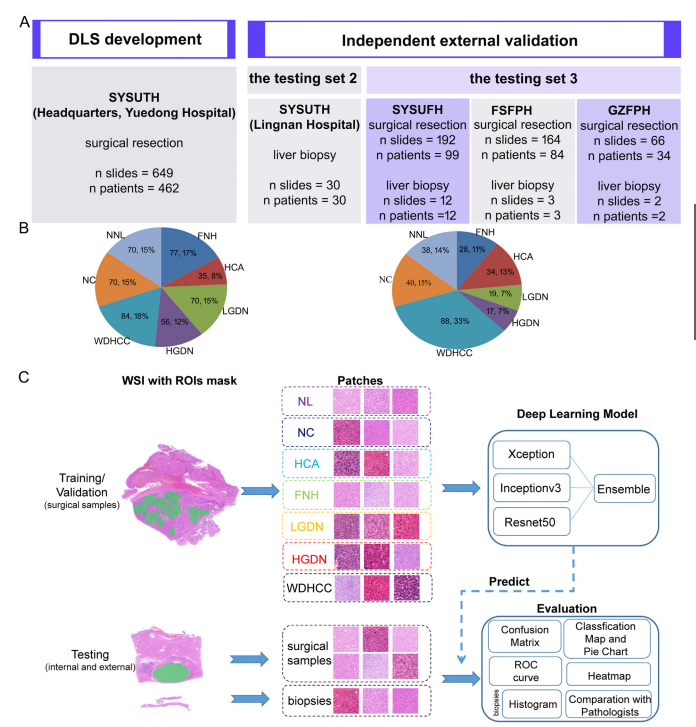
Figure 1. Data, study design, and HnAIM classification framework. Six independent data sets (Headquarters, Lingnan andYuedong Hospital of SYSUTH, SYSUFH, FSFPH, and GZFPH) were used in this study. (A) The Headquarters and YuedongHospital of SYSUTH data sets were used for developing a 7-category discriminative model, while the other 4 data sets wereused for the external testing. (B) The distribution of the samples for each type of liver nodule in model development (left) andindependent external validation (right). (C) Flow chart of the study. The data sets of the 7 categories were divided into thetraining (70%), validation (15%), and testing (15%) sets. Then, ROIs were labeled with green masks for each category. Patcheswere extracted from ROIs by OpenSlide library at 40 magnification with a size of 1024 1024. The training set was used totrain the ensemble model based on 3 basic models, while the validation set was used to fine-tune superparameters, such as learning rate, and the testing set used to evaluate models’ performances by confusion matrix, ROC curve, WSI-level classi-fication map, and patch-level heat map. Patches of liver biopsy specimens were predicted by the optimal model and areshown using a histogram, while the model’s referral decisions were compared with the ones made by different levels ofpathologists.
图1. 数据、研究设计和HnAIM分类框架。本研究使用了六个独立数据集(总部、岭南及SYSUTH的粤东医院、SYSUFH、FSFPH和GZFPH)。(A) 总部和SYSUTH的粤东医院数据集用于开发7类鉴别模型,而其他四个数据集用于外部测试。(B) 模型开发中(左)和独立外部验证中(右)各类型肝结节样本的分布。(C) 研究流程图。7类数据集被划分为训练集(70%)、验证集(15%)和测试集(15%)。然后,每个类别的感兴趣区域(ROIs)用绿色遮罩标记。通过OpenSlide库以40倍放大从ROIs提取1024×1024大小的补丁。训练集用于基于三个基础模型训练集成模型,验证集用于调整超参数,如学习率,测试集用于通过混淆矩阵、ROC曲线、WSI级分类图和补丁级热图评估模型性能。肝活检标本的补丁由最优模型预测,并通过直方图显示,而模型的转诊决定与不同级别的病理医生所做的决定进行比较。
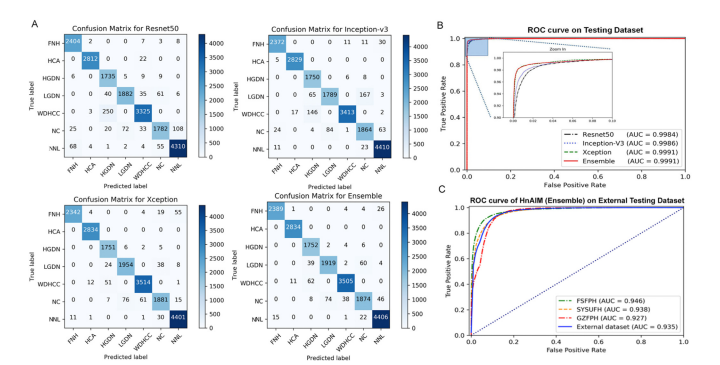
Figure 2. Performance of deep learning models. (A) Classification results are shown by confusion matrices on the internal testing set for Resnet50, Inception V3, Xception, and the Ensemble model. Numbers represent the number of patches classified correctly (diagonal) and incorrectly (off the diagonal). (B) The ROC curve and the AUC value on the internal testing set for models of Resnet50 (black line), Inception V3 (blue line), Xception (green line), and Ensemble (red line). The Xception and the Ensemble models both performed the best, with AUC values of 0.9991, indicating models were trained with high accuracy. (C) The ROC curve and AUC value on the independent external validation using the Ensemble model (HnAIM) in FSFPH, SYSUFH, GZFPH, and the entire external data set.
图2. 深度学习模型的性能。(A) 在内部测试集上,Resnet50、Inception V3、Xception和集成模型的分类结果通过混淆矩阵显示。数字代表正确分类(对角线上)和错误分类(对角线外)的补丁数量。(B) 在内部测试集上,Resnet50(黑线)、Inception V3(蓝线)、Xception(绿线)和集成模型(红线)的ROC曲线和AUC值。Xception和集成模型的表现最佳,AUC值为0.9991,表明模型具有高精度的训练。(C) 使用集成模型(HnAIM)在FSFPH、SYSUFH、GZFPH和整个外部数据集上的独立外部验证的ROC曲线和AUC值。
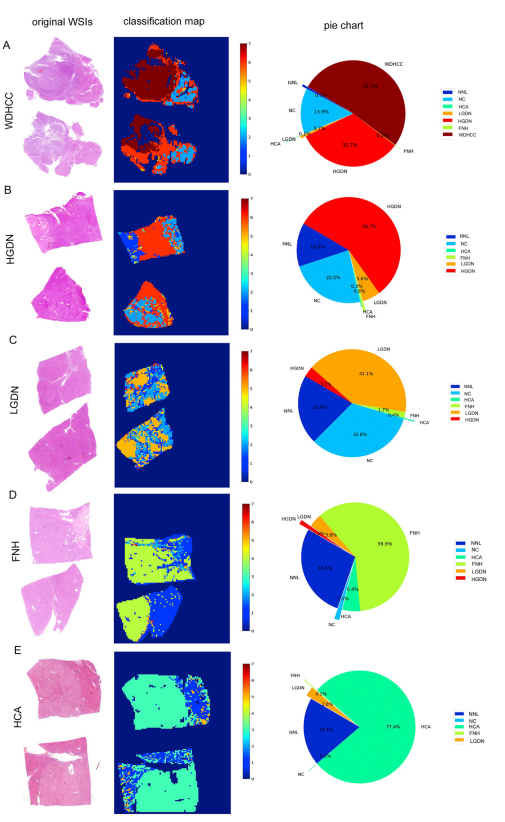
Figure 3. WSI-level panoramicclassification map of surgicalsample: (A) WD-HCC, (B)HGDN, (C), LDN, (D), FNH, and(E) HCA. (Left) Original WSIs(original magnification 0.4).(Middle) Classification mapswere constructed frommodel’s predictions of corresponding patches. Colorsfrom blue to red meantdifferent liver lesions. For NC,LGDN, HGDN, and WDHCC,gradually deepening coloreven indicated increased degree of malignancy (labels: 2,5–7). The diagnostic labelswere as follows: 0 for background, 1 for NNL, 2 for NC, 3for HCA, 4 for FNH, 5 forLGDN, 6 for HGDN, and 7 forWDHCC. (Right) Pie charts
quantitatively show the percentage of different categoriesin each WSI.
图3. 外科样本的WSI级全景分类图:(A) WD-HCC,(B) HGDN,(C) LDN,(D) FNH,和 (E) HCA。(左) 原始WSIs(原始放大倍数0.4)。(中) 分类图根据模型对应补丁的预测构建。颜色从蓝色到红色表示不同的肝脏病变。对于NC、LGDN、HGDN和WDHCC,颜色的逐渐加深甚至表示恶性程度的增加(标签:2,5-7)。诊断标签如下:0代表背景,1代表NNL,2代表NC,3代表HCA,4代表FNH,5代表LGDN,6代表HGDN,7代表WDHCC。(右) 饼图定量显示每个WSI中不同类别的百分比。
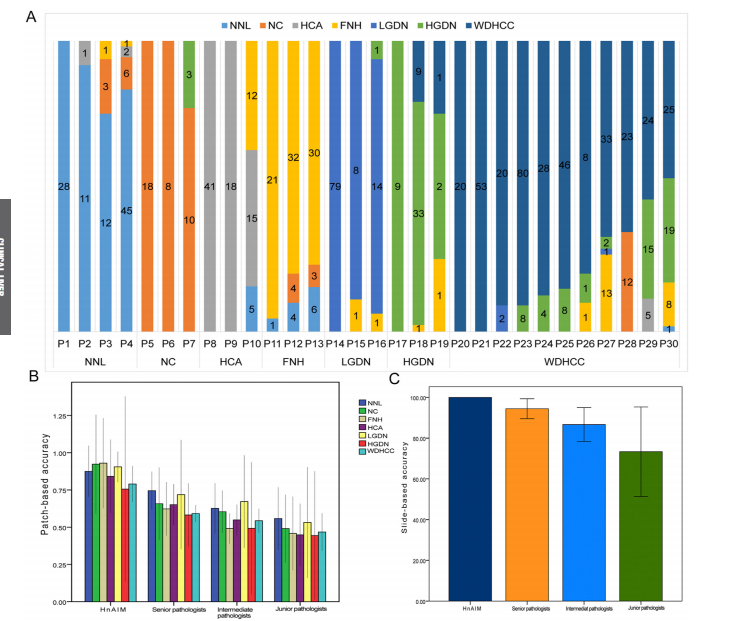
Figure 4. Performance of HnAIM in biopsy specimens and comparison with pathologists. (A) Patch-level histogram of biopsy specimens shows the model’s predictions for 7 categories, with a focus on cell morphologic features. The category with the largest proportion was regarded as the final classification. Agreement rates with the majority opinion of subspecialists for the HnAIM and pathologists (3 each for junior, intermediate, and senior pathologist) on 7 categories across (B) all 961 patches and (C) 30 WSIs of biopsy specimens. To represent the average level of each group, the agreement rate was shown as the mean value across 3 pathologists. The error bars represent the 95% CIs. Potential reasons for disagreements among pathologists with HnAIM may include inherent uncertainty in the 2-dimensional interpretation of a 3-dimensional specimen, ambiguity in diagnostic guidelines, the limited number of tissue samples, and cognitive factors such as anchoring.
图4. HnAIM在活检标本中的表现及与病理医生的比较。(A) 活检标本的补丁级直方图显示了模型对7个类别的预测,重点关注细胞形态特征。占比最大的类别被视为最终分类。HnAIM与亚专家多数意见的一致率以及(B)所有961个补丁和(C)30个活检样本WSI中7个类别的病理医生(初级、中级和高级各3名)的一致率。为代表每组的平均水平,一致率以3名病理医生的平均值显示。误差条表示95%置信区间。病理医生与HnAIM之间意见不一的潜在原因可能包括对三维标本二维解读的固有不确定性、诊断指南的模糊性、组织样本数量有限以及认知因素如锚定效应。
Table
表
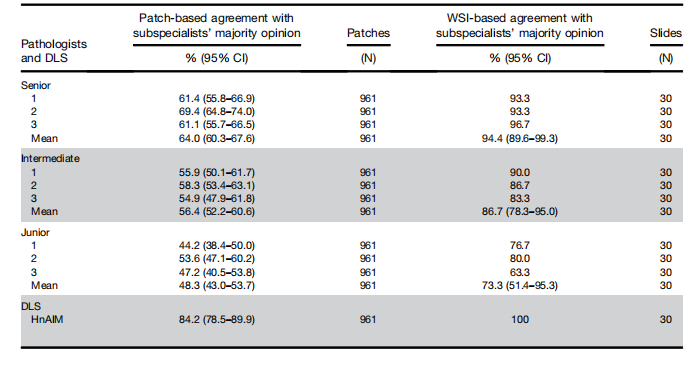
Table 1.Seven-Category Agreement With Subspecialists’ Majority Opinion of 9 Pathologists and Hepatocellular-NodularArtificial Intelligence Model Based on Patches and Whole-Slide Images of 30 Liver Biopsy Specimens
表1. 基于30个肝活检标本的补丁和整片图像的九名病理学家和肝细胞结节性人工智能模型与亚专家多数意见的七类别一致性
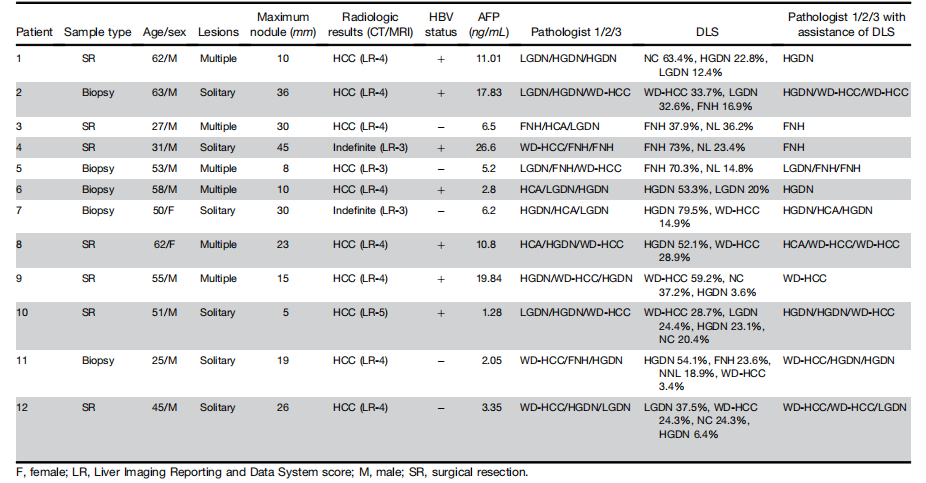
Table 2.Lesion Characteristics of Patients With Indefinite Diagnoses after 3 Independent Reviews
表2. 经过三次独立审查后,诊断不确定的患者的病变特征


