Title
题目
Combined Spiral Transformation and Model-Driven Multi-Modal Deep Learning Scheme for Automatic Prediction of TP53 Mutation in Pancreatic Cancer
螺旋变换与模型驱动的多模态深度学习方案相结合,用于自动预测胰腺癌中TP53突变
01
文献速递介绍
胰腺癌是最致命的恶性肿瘤之一,其特点是诊断晚、死亡率高、总生存率低。患者的五年生存率低于3.5%,其中75%的患者表现出TP53基因突变。作为一个肿瘤抑制基因,TP53用于编码P53蛋白,该蛋白可以在许多细胞过程中抑制细胞增殖。突变的TP53基因促进肿瘤细胞的增殖、侵袭和存活。
特定的TP53突变与预后不良和对治疗方式的抗性有关。针对胰腺癌的靶向治疗正在研究中,而TP53可能是胰腺癌基因增强治疗中一个有吸引力的靶点。因此,TP53的状态可能在治疗选择中起着至关重要的作用。进行手术和活组织检查以进行突变分析是标准的医疗程序;然而,由于临床实践中的侵入性操作,它们不能频繁使用。因此,开发非侵入性方法来预测肿瘤基因突变是必要的。
近年来,医学影像被用于非侵入性评估活体组织中的遗传变化。组织的生物医学成像结果反映了潜在的病理生理特征。特别是,影像中的定量参数,如肿瘤的强度、形状、大小、体积和纹理,提供了关于肿瘤表型和微环境的重要信息。
放射组学方法在非侵入性评估遗传变化方面取得了有希望的结果。例如,Eran等在CT影像和原发性人类肝癌的基因表达之间获得了相关性;Coudray等使用肺癌的组织病理学影像提取直方图并预测如TP53等基因突变。研究提取了部分放射组学特征,如形状、纹理和密度,然后选定特征并建立机器学习模型来预测基因突变。
Abstract-Background
摘要
Pancreatic cancer is a malignant form of cancer with one of the worst prognoses. The poor prog nosis and resistance to therapeutic modalities have been linked to TP53 mutation. Pathological examinations, such as biopsies, cannot be frequently performed in clinical practice; therefore, noninvasive and reproducible methods are desired. However, automatic prediction methods based on imaging have drawbacks such as poor 3D information utilization, small sample size, and ineffectiveness multi modal fusion. In this study, we proposed a model-driven multi-modal deep learning scheme to overcome these chal lenges. A spiral transformation algorithm was developed to obtain 2D images from 3D data, with the transformed image inheriting and retaining the spatial correlation of the original texture and edge information. The spiral transfor mation could be used to effectively apply the 3D informa tion with less computational resources and conveniently augment the data size with high quality. Moreover, model driven items were designed to introduce prior knowledge in the deep learning framework for multi-modal fusion. The model-driven strategy and spiral transformation-based data augmentation can improve the performance of the small sample size. A bilinear pooling module was introduced to improve the performance of fine-grained prediction. The experimental results show that the proposed model gives the desired performance in predicting TP53 mutation in pancreatic cancer, providing a new approach for noninva sive gene prediction. The proposed methodologies of spiral transformation and model-driven deep learning can also be used for the artificial intelligence community dealing with oncological applications.
胰腺癌是一种恶性癌症,预后极差。预后不良和对治疗方式的抗性与TP53突变有关。如活组织检查等病理学检查不能在临床实践中频繁进行;因此,需要非侵入性且可重复的方法。然而,基于影像的自动预测方法存在缺陷,如3D信息利用不足、样本量小、多模态融合无效等。在本研究中,我们提出了一种模型驱动的多模态深度学习方案,以克服这些挑战。开发了一种螺旋变换算法,从3D数据中获得2D图像,转换后的图像继承并保留了原始纹理和边缘信息的空间相关性。螺旋变换可以有效地利用3D信息,减少计算资源消耗,并方便地用高质量增加数据大小。此外,设计了模型驱动项目,在深度学习框架中引入先验知识进行多模态融合。模型驱动策略和基于螺旋变换的数据增强可以提高小样本量的性能。引入了双线性池化模块,以提高细粒度预测的性能。实验结果表明,所提出的模型在预测胰腺癌中TP53突变方面提供了期望的性能,为非侵入性基因预测提供了一种新方法。螺旋变换和模型驱动深度学习的提出方法也可以用于处理肿瘤应用的人工智能社区。
CONCLUSION
结论
In this study, we proposed a model-driven multi-modal deep learning model for the automated prediction of TP53 mutation in pancreatic cancer based on a small amount of data. A spiral transformation method was developed to apply 3D information with less computational resources and effectively augment the data. Model-driven items are also proposed to use the prior knowledge in the deep learning framework for fusing multi modal information and improve the performance of the small sample size. A bilinear module was introduced in the model driven model to improve the performance of fine-grained prediction. Extensive experiments confirmed the performance and robustness of our proposed in predicting the TP53 muta tion in pancreatic cancer. The proposed methodologies for the utilization of 3D information with small sample size and effective multi-modal fusion are potential paradigms for medical imaging analyses.
在本研究中,我们提出了一种模型驱动的多模态深度学习模型,用于基于少量数据自动预测胰腺癌中TP53突变。开发了一种螺旋变换方法,以较少的计算资源应用3D信息并有效增强数据。还提出了使用模型驱动项目,在深度学习框架中利用先验知识融合多模态信息,并改善小样本量的性能。在模型驱动模型中引入了一个双线性模块,以提高细粒度预测的性能。广泛的实验确认了我们提出的在预测胰腺癌TP53突变方面的性能和鲁棒性。提出的方法论,对于小样本量下3D信息的利用和有效的多模态融合,是医学影像分析的潜在范式。
Method
方法
A. Data Augmentation
The most common data augmentation method for
images is geometric transformation. Rajpurkar [18] and Valvano et al. [19] performed horizontal flip, rotation, scaling, and other transformations on 2D images to increase the amount of data. Zhao et al. [20] translated by small amounts, zoomed in on small-range multiples , and rotated original data while extracting 3D patches. In the training process, real time data augmentation methods have a strong regularization effect on the model. Guan et al. performed a random selection without changing the total amount of data for the above-mentioned geometric transformation; they consequently improved the robustness of the network. Alex proposed principal component analysis (PCA) jittering to perform fea ture decomposition on each channel of the RGB to obtain feature vectors and feature values and then alter the intensity of each channel. Color jittering, a method similar to PCA jittering, can be used to change the contrast and brightness of an image. Geometric transformation methods can increase the model’s robustness to some extent. However, the amount of information in the data before and after the geometric trans formation is largely similar, thus limiting the augmentationeffect.A.
数据增强
对图像来说,最常见的数据增强方法是几何变换。Rajpurkar [18] 和 Valvano 等人[19] 对2D图像执行了水平翻转、旋转、缩放和其他变换,以增加数据量。赵等人[20]通过小幅度平移、在小范围内放大([0.8,1.15]倍)以及在提取3D补丁时旋转原始数据。在训练过程中,实时数据增强方法对模型有很强的正则化效果。关等人[21]对上述几何变换进行了随机选择,不改变数据的总量,从而提高了网络的鲁棒性。Alex [22]提出了主成分分析(PCA)抖动,对RGB的每个通道进行特征分解,以获得特征向量和特征值,然后改变每个通道的强度。类似于PCA抖动的颜色抖动方法,可以用来改变图像的对比度和亮度。几何变换方法在某种程度上可以增加模型的鲁棒性。然而,几何变换前后数据中的信息量大体相似,从而限制了增强效果。
Figure
图
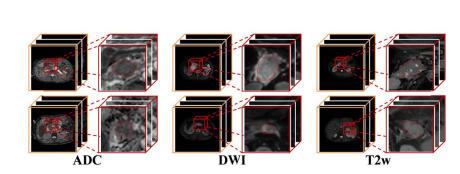
Fig. 1. Examples of pancreatic cancer dataset. The first column of each modal image is the original data, and the second column is the enlarged region. Pancreatic cancers have small size and unclear boundaries.
图 1. 胰腺癌数据集的示例。每个模态图像的第一列是原始数据,第二列是放大区域。胰腺癌体积小且边界不清晰。
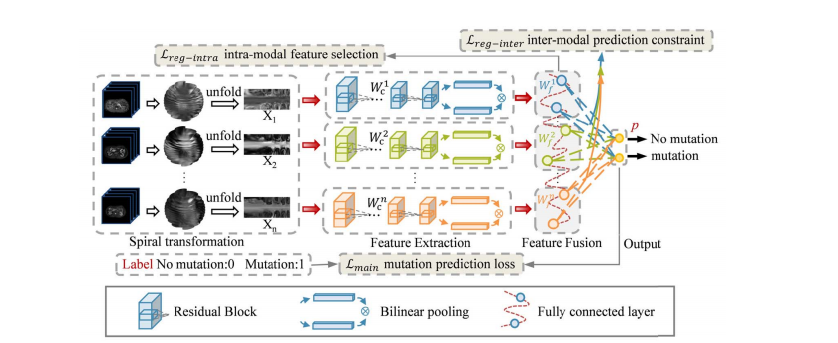
Fig. 2. The framework of the proposed model. The pipeline includes modules for spiral transformation, feature extraction, feature fusion, and output. Three parts, mutation prediction loss, intra-modal feature selection loss, and inter-modal prediction constraint loss are combined to supervise training process.
图 2. 所提模型的框架。流程包括螺旋变换、特征提取、特征融合和输出模块。
三个部分,突变预测损失、内模态特征选择损失和跨模态预测约束损失结合起来监督训练过程。
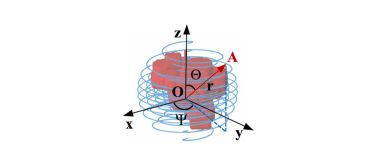
Fig. 3. Coordinate System of Spiral-transform. The coordinate origin O is the midpoint of spiral transformation. And the spiral line was calculated by Θ, Ψ and r.
图 3. 螺旋变换的坐标系统。坐标原点O是螺旋变换的中点。螺旋线通过Θ、Ψ和r计算得出。
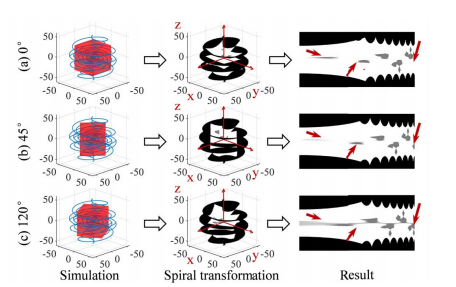
Fig. 4. The data augmentation results using the spiral transformation in different coordinate systems. To show more intuitively, coordinate systems are fixed in the same view. The coordinate systems (b) and (c) are rotated by 45 degrees and 120 degrees, respectively, relative to (a) in the x-y plane. The same 3D object obtains different mappings in the three 2D spiral transformed images as shown in the third column.
图 4. 在不同坐标系统中使用螺旋变换的数据增强结果。为了更直观地展示,坐标系统在相同视图中固定。坐标系统(b)和(c)分别相对于(a)在x-y平面中旋转了45度和120度。如第三列所示,相同的3D对象在三个2D螺旋变换图像中获得不同的映射。
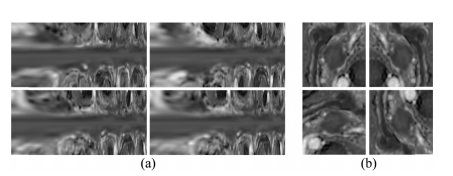
Fig. 5. Two types of examples from augmented data by spiral transfor mation (a) and 2D geometric transformation (b), respectively. The upper left of each sub-figure is the original data, and others are augmenteddata.
图 5.通过螺旋变换(a)和2D几何变换(b)分别增强的数据中的两种示例。每个子图的左上角是原始数据,其他的是增强后的数据。
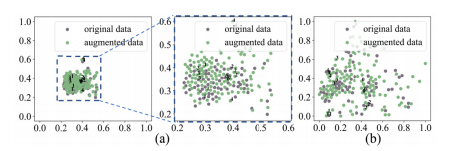
Fig. 6. t-SNE visualization. (a) Geometric transformation (b) Spiral transformation. Points with same number are from same original data.
图 6. t-SNE可视化。(a) 几何变换 (b) 螺旋变换。相同编号的点来自同一原始数据。
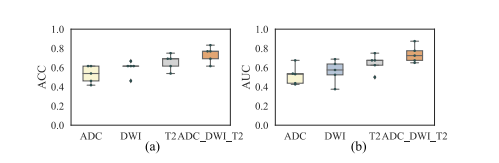
Fig. 7. ACC and AUC of different imaging inputs. Each point represents the results of one fold in the five-fold CV experiments.
图 7. 不同影像输入的ACC和AUC。每个点代表五折交叉验证实验中一折的结果。
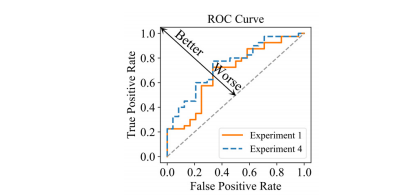
Fig. 8. ROC curve of the prediction model with/without the model driven items. Experiment 1: Loss is Lmain. Experiment 4: Loss is Lmain + β**Lreg-intra + γL**reg-inter.
图 8.带/不带模型驱动项目的预测模型的ROC曲线。实验1:损失为Lmain。实验4:损失为Lmain + β**Lreg-intra + γL**reg-inter。
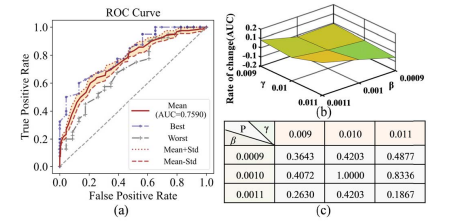
Fig. 9. (a) ROC curve of different β and γ. (b) Change rate of AUC in different β and γ. (c) p-value of ROC curves between different (β, γ) with (β = 0.001, γ = 0.01).
图 9. (a) 不同β和γ的ROC曲线。(b) 在不同的β和γ中AUC的变化率。(c) 在不同的(β, γ)与(β = 0.001, γ = 0.01)之间ROC曲线的p值。
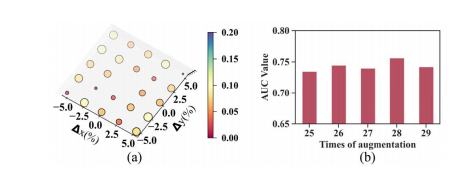
Fig. 10. (a) The relationship between the AUC variation and the origin coordinates of the spiral transformation. The x-axis and y-axis represent the percentage of the origin offset along coronal axis and sagittal axis, respectively. (b) AUC values at different times of augmentation.
图 10. (a) AUC变化与螺旋变换原点坐标之间的关系。x轴和y轴分别代表沿冠状轴和矢状轴的原点偏移百分比。(b) 在不同增强次数下的AUC值。
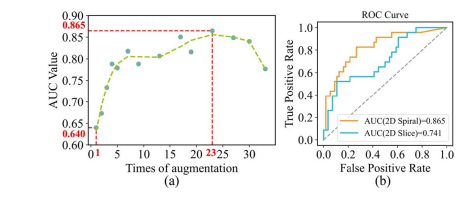
Fig. 11. (a) AUC values at different times of augmentation on H&N1 dataset. (b) The ROC curve of spiral model and 2D model at 23 augmentation times on H&N1 dataset.
图 11. (a) 在H&N1数据集上不同增强次数下的AUC值。(b) 在H&N1数据集上23次增强后螺旋模型和2D模型的ROC曲线。
Table
表
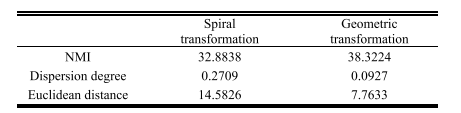
TABLE I comparison of two data augmentation methods
表 I两种数据增强方法的比较
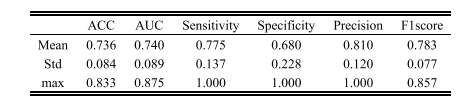
TABLE II the prediction performance of our proposed model based on five-fold cv
表 II基于五折交叉验证的我们提出的模型的预测性能
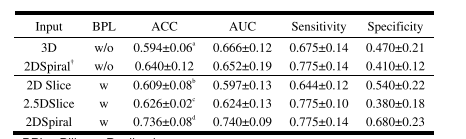
TABLE III prediction performance comparison the multi-modal models with different input (MEAN±STD)
表 III 不同输入的多模态模型的预测性能比较(均值±标准差)
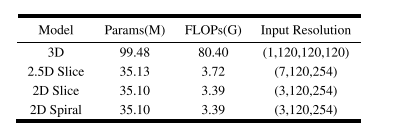
TABLE IV complexity comparison of the multi -modal models with different input
表 IV不同输入的多模态模型的模型复杂性比较
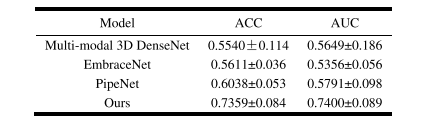
TABLE V multi-modal clssification results of different models
表 V不同模型的多模态分类结果
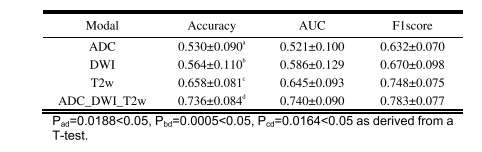
TABLE VI prdiction performance comparison between single-modal and multi-modal imaging (MEAN±STD)
表 VI 单模态与多模态成像的预测性能比较(均值±标准差)
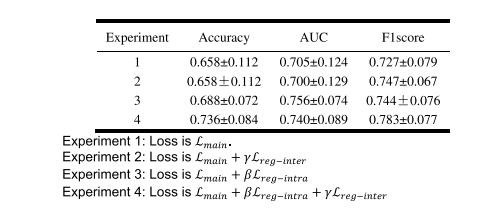
TABLE VII performance comparison of the prediction model with/without the model-driven items
表 VII 预测模型使用/不使用模型驱动项目的性能比较
TABLE VIII HPV prediction results of existing methods on H&N1 dataset
表 VIII现有方法在H&N1数据集上的HPV预测结果


