使用的数据
这次,我们将使用日本空间信息中心发布的“新宿站室内地图开放数据”的集成版本(ShapeFile)。
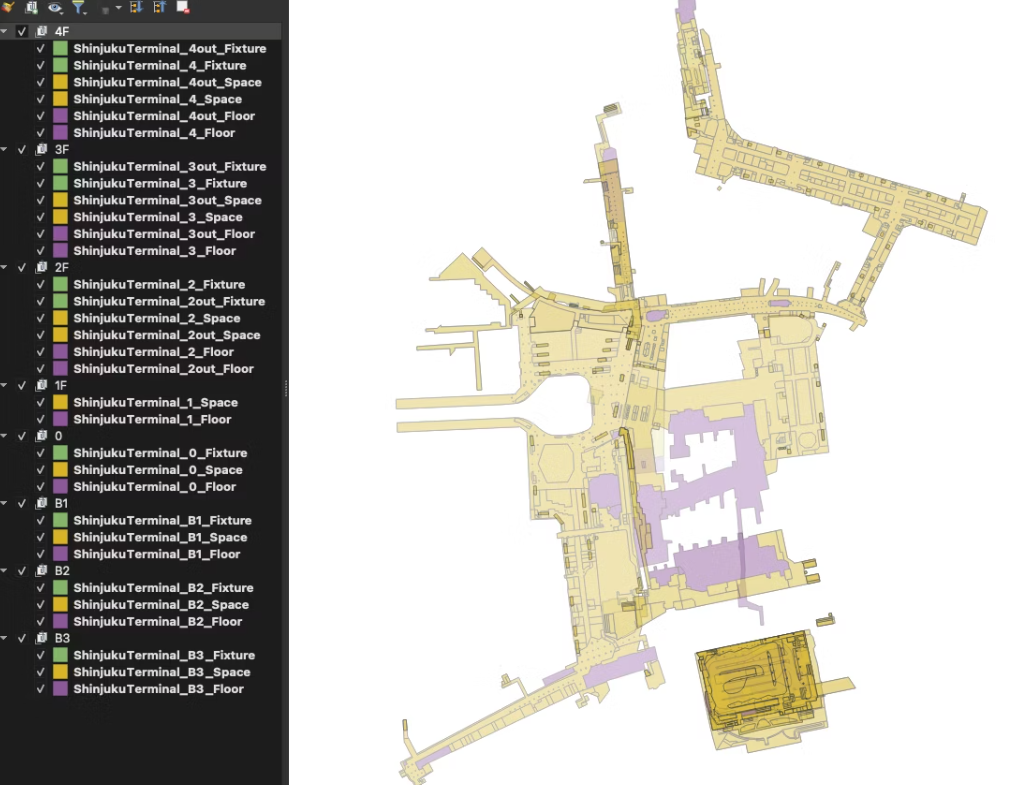
要素数据
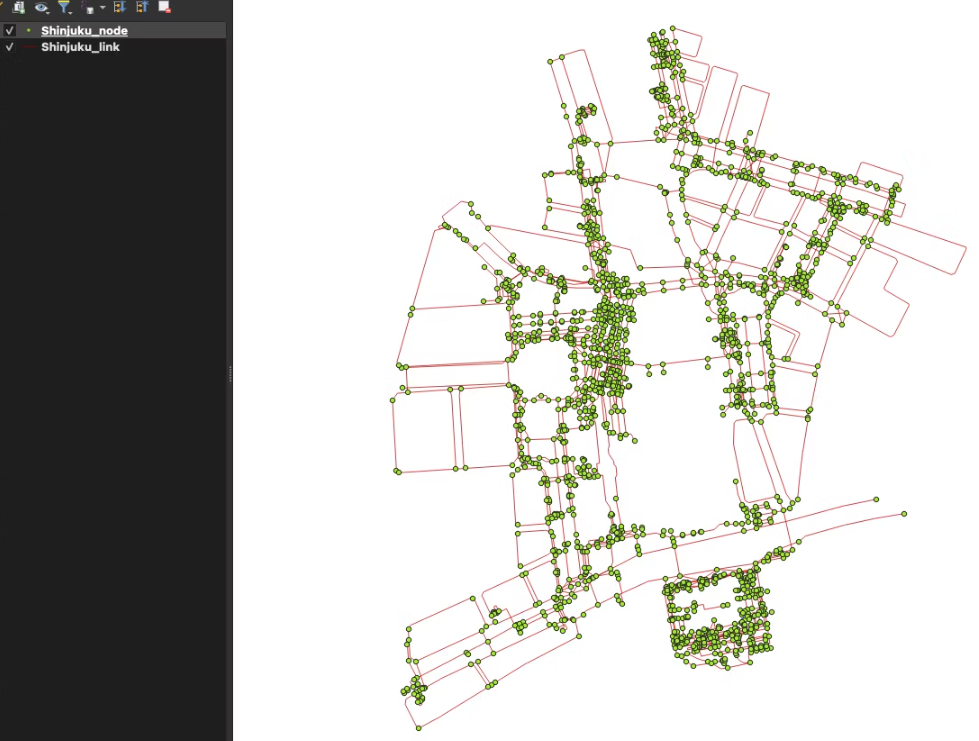
网络数据
数据转换
所有这些数据都是 ShapeFile,我们可以使用 GDAL 命令将 ShapeFile 转换为 GeoJson。
mkdir geojson

for f in *.shp; do
  ogr2ogr -f GeoJSON -t_srs EPSG:6677 "geojson/${f%.*}.geojson" $f
done
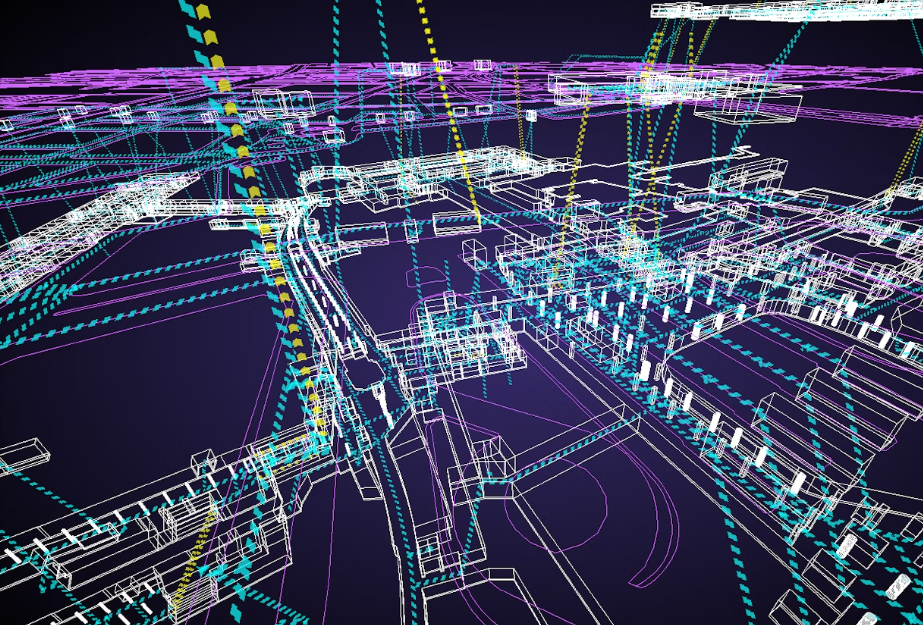
使用 Three.js 绘制
创建场景
创建场景并添加相机和控制器。在本文中,我将把移动操作分配给 MapControls,将缩放操作分配给 TrackballControls。
import * as THREE from 'three';
import { MapControls } from 'three/examples/jsm/controls/MapControls.js';
import { TrackballControls } from 'three/examples/jsm/controls/TrackballControls.js';

const sizes = {
  width: window.innerWidth,
  height: window.innerHeight,
};

// 创建画布
const canvas = document.createElement('canvas');
document.body.appendChild(canvas);

// 创建场景
const scene = new THREE.Scene();

// 创建相机
const camera = new THREE.PerspectiveCamera(75, sizes.width / sizes.height, 0.1, 100000);
camera.position.set(-190, 280, -350);
scene.add(camera);

// 创建控制器
const mapControls = new MapControls(camera, canvas);
mapControls.enableDamping = true;
mapControls.enableZoom = false;
mapControls.maxDistance = 1000;

const zoomControls = new TrackballControls(camera, canvas);
zoomControls.noPan = true;
zoomControls.noRotate = true;
zoomControls.noZoom = false;
zoomControls.zoomSpeed = 0.5;

// 渲染器
const renderer = new THREE.WebGLRenderer({
  canvas: canvas,
  alpha: true,
});
renderer.setSize(sizes.width, sizes.height);
renderer.setPixelRatio(Math.min(window.devicePixelRatio, 2));

// 当屏幕大小调整时,画布也会调整大小
const onResize = () => {
  // 获取尺寸大小
  const width = window.innerWidth;
  const height = window.innerHeight;

  // 调整渲染器大小
  renderer.setPixelRatio(window.devicePixelRatio);
  renderer.setSize(width, height);

  // 修正相机纵横比
  camera.aspect = width / height;
  camera.updateProjectionMatrix();
};
window.addEventListener('resize', onResize);

const animate = () => {
  requestAnimationFrame(animate);

  const target = mapControls.target;
  mapControls.update();
  zoomControls.target.set(target.x, target.y, target.z);
  zoomControls.update();
  renderer.render(scene, camera);
};
animate();
另外,在 WebGLRenderer 选项中设置 alpha: true 以使背景透明并使用 CSS 将渐变应用于背景。
canvas {
  background-image: radial-gradient(#382c6e, #000000);
}

创建 GUI 和组
在场景中绘制要素数据。这次我们按图层对要素进行分组,因此需要提前在场景中创建一个组,并将使用要素数据创建的对象添加到每个图层的组中。我们还将添加一个复选框 GUI,以便可以切换每个层次结构的显示。
import { GUI } from 'three/examples/jsm/libs/lil-gui.module.min.js';

// 创建 dat.GUI 的实例
const gui = new GUI({ width: 150 });

// 创建一个群组
const groupList = [4, 3, 2, 1, 0, -1, -2, -3];
const layers = ['4F', '3F', '2F', '1F', '0', 'B1', 'B2', 'B3'];

groupList.forEach((num, i) => {
  const group = new THREE.Group();
  group.name = `group${num}`;
  scene.add(group);
  const key = `group${num}`;

  // 将复选框添加到 GUI
  gui.add(
    {
      [key]: true,
    },
    key,
  )
    .onChange((isVisible) => {
      scene.getObjectByName(key).visible = isVisible;
    })
    .name(layers[i]);
});
添加要素数据
往每个层组添加要素数据。由于要素数据是二维多边形数据,因此可以使用ExtrudeGeometry对其进行挤压,使其变为三维。虽然文件名中有层级结构信息,但没有高度信息,因此我们将根据特征数据的类型来划分高度。
另外,由于上述转换过程,特征数据已转换为 EPSG:6677,为了方便在threejs中查看,需要对要素进行偏移。首先,确定 EPSG:6677 上的哪个坐标点应作为场景的原点 0。这里我们将点 -12035.29、-34261.85(x,y) 与世界坐标原点 0 对齐,这样可以更好的查看。
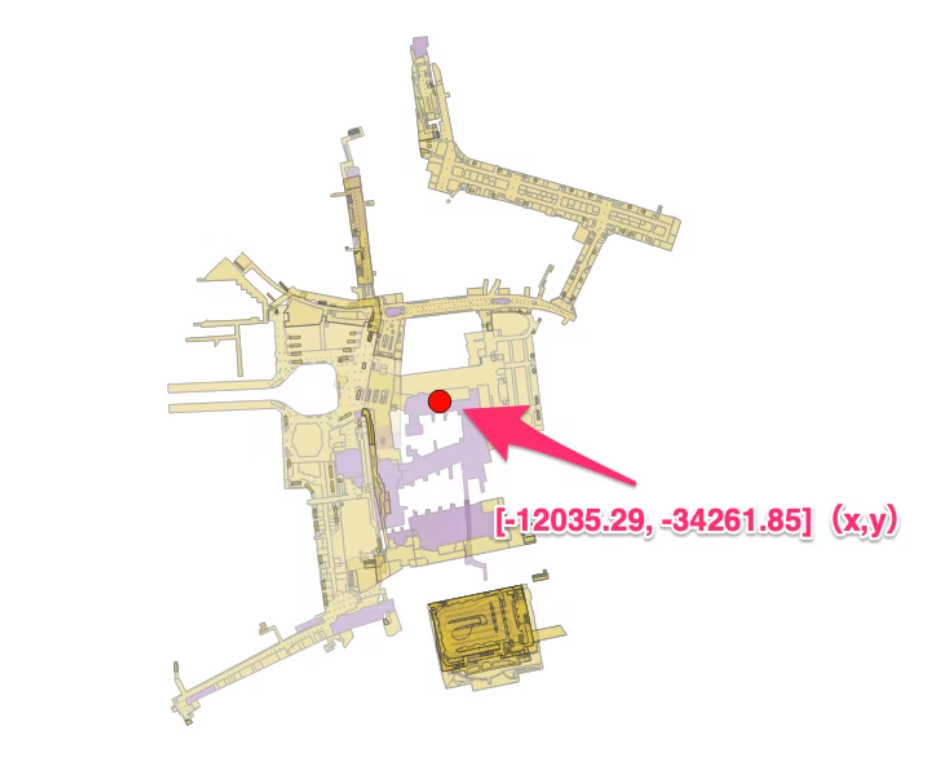
当从要素数据的多边形坐标值创建ExtrudeGeometry时,通过从每个坐标点减去中心点([-12035.29,-34261.85])来应用偏移,这样要素就会被绘制到靠近场景原点的位置。
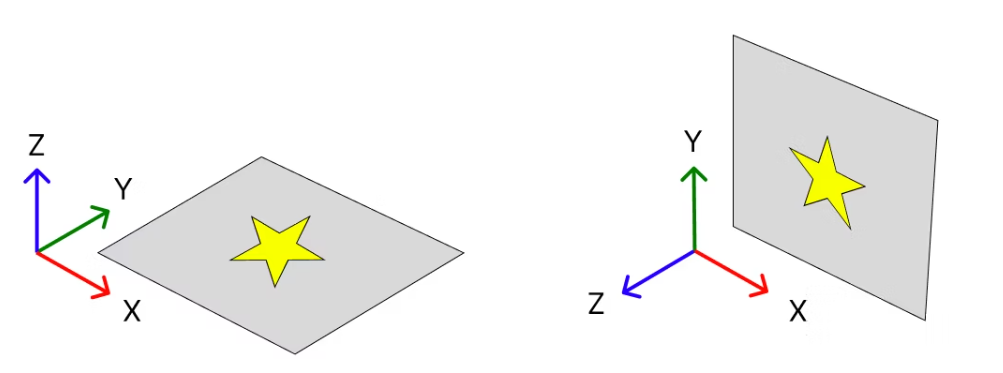
另外需要注意的是,Three.js(世界坐标)上的Y和Z向量方向与GIS(地理坐标)上的Y和Z向量方向相差90度,所以创建ExtrudeGeometry后,要从x轴开始。
接下来我们从 GeoJson 创建 ExtrudeGeometry。将Space、Floor、Fixture数据写入每个数组并循环处理,使用函数getFloorNumber获取层级信息,使用函数loadAndAddToScene输入GeoJson信息、层级信息和高度值。
// Space数组
const SpaceLists = [
    './ShinjukuTerminal/ShinjukuTerminal_B3_Space.geojson',
    './ShinjukuTerminal/ShinjukuTerminal_B2_Space.geojson',
    './ShinjukuTerminal/ShinjukuTerminal_B1_Space.geojson',
    './ShinjukuTerminal/ShinjukuTerminal_0_Space.geojson',
    './ShinjukuTerminal/ShinjukuTerminal_1_Space.geojson',
    './ShinjukuTerminal/ShinjukuTerminal_2_Space.geojson',
    './ShinjukuTerminal/ShinjukuTerminal_2out_Space.geojson',
    './ShinjukuTerminal/ShinjukuTerminal_3_Space.geojson',
    './ShinjukuTerminal/ShinjukuTerminal_3out_Space.geojson',
    './ShinjukuTerminal/ShinjukuTerminal_4_Space.geojson',
    './ShinjukuTerminal/ShinjukuTerminal_4out_Space.geojson',
];

// Space加载
SpaceLists.forEach((geojson) => {
    const floorNumber = getFloorNumber(geojson, 'Space');
    if (floorNumber !== null) {
        loadAndAddToScene(geojson, floorNumber, 5);
    }
});


// Floor数组
const FloorLists = [
    './ShinjukuTerminal/ShinjukuTerminal_B3_Floor.geojson',
    './ShinjukuTerminal/ShinjukuTerminal_B2_Floor.geojson',
    './ShinjukuTerminal/ShinjukuTerminal_B1_Floor.geojson',
    './ShinjukuTerminal/ShinjukuTerminal_0_Floor.geojson',
    './ShinjukuTerminal/ShinjukuTerminal_1_Floor.geojson',
    './ShinjukuTerminal/ShinjukuTerminal_2_Floor.geojson',
    './ShinjukuTerminal/ShinjukuTerminal_2out_Floor.geojson',
    './ShinjukuTerminal/ShinjukuTerminal_3_Floor.geojson',
    './ShinjukuTerminal/ShinjukuTerminal_3out_Floor.geojson',
    './ShinjukuTerminal/ShinjukuTerminal_4_Floor.geojson',
    './ShinjukuTerminal/ShinjukuTerminal_4out_Floor.geojson',
];

// Floor加载
FloorLists.forEach((geojson) => {
    const floorNumber = getFloorNumber(geojson, 'Floor');
    if (floorNumber !== null) {
        loadAndAddToScene(geojson, floorNumber, 0.5);
    }
});

// Fixture数组
const FixtureLists = [
    './ShinjukuTerminal/ShinjukuTerminal_B3_Fixture.geojson',
    './ShinjukuTerminal/ShinjukuTerminal_B2_Fixture.geojson',
    './ShinjukuTerminal/ShinjukuTerminal_B1_Fixture.geojson',
    './ShinjukuTerminal/ShinjukuTerminal_0_Fixture.geojson',
    './ShinjukuTerminal/ShinjukuTerminal_2_Fixture.geojson',
    './ShinjukuTerminal/ShinjukuTerminal_2out_Fixture.geojson',
    './ShinjukuTerminal/ShinjukuTerminal_3_Fixture.geojson',
    './ShinjukuTerminal/ShinjukuTerminal_3out_Fixture.geojson',
    './ShinjukuTerminal/ShinjukuTerminal_4_Fixture.geojson',
    './ShinjukuTerminal/ShinjukuTerminal_4out_Fixture.geojson',
];

// Fixture加载
FixtureLists.forEach((geojson) => {
    const floorNumber = getFloorNumber(geojson, 'Fixture');
    if (floorNumber !== null) {
        loadAndAddToScene(geojson, floorNumber, 5);
    }
});
getFloorNumber函数如下。我使用正则表达式提取文件名的数字部分,如果它包含“B”(位于地下),则返回负数。
// 使用正则表达式获取层数
const getFloorNumber = (geojson, type) => {
    const regex = new RegExp(`ShinjukuTerminal_([-B\\d]+)(out)?_${type}`);
    const match = geojson.match(regex);
    if (!match) return null;

    let floor = match[1].replace('B', '-');
    return parseInt(match[2] === 'out' ? floor.replace('out', '') : floor, 10);
};
loadAndAddToScene函数如下。使用 FileLoader 加载 GeoJson,使用名为 createExtrudedGeometry 的函数生成 ExtrudeGeometry,并通过从 ExtrudeGeometry 创建 EdgesGeometry 来创建轮廓立方多边形。此时,立方体多边形是垂直方向的,因此使用 applyMatrix4 将其旋转 90 度。
然后,我们决定在Y轴上放置每层信息的要素并将其添加到每层的Group中。
// 每层Y轴方向距离
const verticalOffset = 30;

// 实例化文件加载器。获取JSON格式的数据
const loader = new THREE.FileLoader().setResponseType('json');

// 加载文件并将其添加到场景中,排除那些没有几何信息的
const loadAndAddToScene = (geojson, floorNumber, depth) => {
    loader.load(geojson, (data) => {
        // Line材质
        const lineMaterial = new THREE.LineBasicMaterial({ color: 'rgb(255, 255, 255)' });

        // 排除那些没有几何信息的
        data.features
            .filter((feature) => feature.geometry)
            .forEach((feature) => {
                // 生成ExtrudeGeometry
                const geometry = createExtrudedGeometry(feature.geometry.coordinates, depth);

                // 旋转 90 度
                const matrix = new THREE.Matrix4().makeRotationX(Math.PI / -2);
                geometry.applyMatrix4(matrix);

                // 生成EdgesGeometry
                const edges = new THREE.EdgesGeometry(geometry);
                const line = new THREE.LineSegments(edges, lineMaterial);
                line.position.y += floorNumber * verticalOffset - 1;

                // 添加到Group
                const group = scene.getObjectByName(`group${floorNumber}`);
                group.add(line);
            });
    });
};
createExtrudedGeometry 如下。如上所述,这里我们根据 GeoJson 的坐标创建一个 ShapeGeometry,它是 ExtrudedGeometry 的来源。每个坐标点都预先从中心减去其地理坐标。
此外,地理空间多边形数据需要顶点来闭合多边形,因此顶点数组的开头和结尾具有相同的顶点坐标(矩形多边形有 5 个顶点)。 ShapeGeometry 不需要最后一个顶点,因此我们跳过最后一个顶点的处理。ExtrudeGeometry 的depth选项表示挤出高度。
// 场景中心的地理坐标 (EPSG:6677)
const center = [-12035.29, -34261.85];

// 从多边形返回 ExtrudeGeometry 的函数
const createExtrudedGeometry = (coordinates, depth) => {
    const shape = new THREE.Shape();

    // 从多边形坐标创建形状
    coordinates[0].forEach((point, index) => {
        const [x, y] = point.map((coord, idx) => coord - center[idx]);
        if (index === 0) {
            // 移动到第一个点
            shape.moveTo(x, y);
        } else if (index + 1 === coordinates[0].length) {
            // 使用 closePath 关闭最后一个点
            shape.closePath();
        } else {
            // 其他 lineTo
            shape.lineTo(x, y);
        }
    });
    return new THREE.ExtrudeGeometry(shape, {
        steps: 1,
        depth: depth,
        bevelEnabled: false,
    });
};

添加网络数据
接下来,将网络数据(行人网络)添加到场景中。使用之前实例化的FileLoader加载上面转换的节点数据的GeoJson,获取nodeId和ordinal(楼层信息),创建一个数组,并将其传递给名为createLink的函数。
// 从节点数据中获取node_id和层次结构(ordinal)
loader.load('./nw/Shinjuku_node.geojson', (data) => {
    const nodeIds = data.features.map((feature) => {
        return {
            node_id: feature.properties.node_id,
            ordinal: feature.properties.ordinal,
        };
    });

    // 创建行人网络
    creatingLink(nodeIds);
});
creatingLink函数如下所示。加载链接数据并从之前创建的数组中获取链接数据的起点和终点的层数结构,这是因为链接的数据不包含楼层信息(可以提前使用 QGIS 表连接添加楼层信息)。
虽然我们可以看到链接数据的起点和终点的层数结构,但是不知道之间的线的楼层落在哪里。因此,我们将准备一个条件分支,如果只找到起点的节点数据,则在起点的层高创建一条链接数据线,如果只找到终点的节点数据,则在终点的层高创建链接数据线。如果起点和终点的节点数据都找到了,如果起点和终点在同一层,就知道该链接数据线只存在于该层,但如果起点和终点在同一层的不同楼层,那么,我就暂时在中间层划一条线。
另外,链接数据线采用MeshLine,因为可以画宽线。在代码的后半部分,我特意将线分割成顶点位于两点之间的线,使用BufferGeometryUtils将它们合并,然后将它们添加到场景中,其原因将在后面解释。
import * as BufferGeometryUtils from 'three/examples/jsm/utils/BufferGeometryUtils.js';
import { MeshLine, MeshLineMaterial } from 'three.meshline';

// 线材质
const linkMaterial = new MeshLineMaterial({
    transparent: true,
    lineWidth: 1,
    color: new THREE.Color('rgb(0, 255, 255)'),
});

const meshLines = [];

// 创建步行网络
const creatingLink = (nodeId) => {
    loader.load('./nw/Shinjuku_link.geojson', (data) => {
        data.features.forEach((feature) => {
            const coordinates = feature.geometry.coordinates;

            // 从节点数据中获取start_id和end_id
            const start_id = nodeId.find((node) => node.node_id === feature.properties.start_id);
            const end_id = nodeId.find((node) => node.node_id === feature.properties.end_id);

            // 创建 3D 点数组
            const points = coordinates.map((point, index) => {
                let y;

                if (!start_id && !end_id) {
                    // 如果没有start_id和end_id,则放在第0层
                    y = 0;
                } else if (start_id && !end_id) {
                    // 如果只有start_id,则将其放入start_id层次结构中
                    y = start_id.ordinal;
                } else if (!start_id && end_id) {
                    // 如果只有end_id,则将其放入end_id的层次结构中
                    y = end_id.ordinal;
                } else {
                    // 如果有 start_id 和 end_id
                    if (index === 0) {
                        // 对于第一点,将其放置在 start_id 层次结构中
                        y = start_id.ordinal;
                    } else if (index === coordinates.length - 1) {
                        // 如果是最后一个点,则将其放入end_id的层次结构中
                        y = end_id.ordinal;
                    } else if (start_id.ordinal === end_id.ordinal) {
                        // 如果 start_id 和 end_id 位于同一层次结构中,则将它们放入该层次结构中
                        y = end_id.ordinal;
                    } else {
                        // 如果start_id和end_id位于不同的层次结构中,则将它们放在中间层次结构中
                        y = Math.round((start_id.ordinal + end_id.ordinal) / 2);
                    }
                }
                return new THREE.Vector3(point[0] - center[0], y * verticalOffset + 1, -(point[1] - center[1]));
            });

            // 从point数组创建MeshLine
            points.forEach((point, index) => {
                // 如果是最后一点,则结束流程
                if (index + 1 === points.length) return;

                // 创建MeshLine。在两点之间创建单独的网格线
                const geometry = new THREE.BufferGeometry().setFromPoints([point, points[index + 1]]);
                const line = new MeshLine();
                line.setGeometry(geometry);

                // 添加到 MeshLine 数组
                const mesh = new THREE.Mesh(line, linkMaterial);
                meshLines.push(mesh.geometry);
            });
        });

        // 合并MeshLine
        const linkGeometry = new THREE.Mesh(BufferGeometryUtils.mergeGeometries(meshLines), linkMaterial);
        linkGeometry.name = 'link';

        // 添加到场景
        scene.add(linkGeometry);
    });
};
编写着色器
接下来我们使行人网络连接线流动起来。这次我们使用的数据有两种模式:(1)双向和(2)从起点到终点的方向,所以我们准备了两个简单的着色器应用于网格线。
首先,从之前定义的 MeshLineMaterial 中删除颜色信息。然后,使用onBeforeCompile添加着色器以覆盖MeshLine中现有的着色器。
// 添加着色器
linkMaterial.onBeforeCompile = (shader) => {
    // 将 uniforms 添加到 userData
    Object.assign(shader.uniforms, linkMaterial.userData.uniforms);

    const keyword1 = 'void main() {';
    shader.vertexShader = shader.vertexShader.replace(
        keyword1,
        /* GLSL */ `
        varying vec2 vUv;
        attribute float uDistance;
        attribute float uDirection;
        varying float vDistance;
        varying float vDirection;
        ${keyword1}`,
    );

    // 替换并添加到着色器
    const keyword2 = 'vUV = uv;';
    shader.vertexShader = shader.vertexShader.replace(
        keyword2,
        /* GLSL */ `
        ${keyword2}
        vUv = uv;
        vDistance = uDistance;
        vDirection = uDirection;
        `,
    );

    const keyword3 = 'void main() {';
    shader.fragmentShader = shader.fragmentShader.replace(
        keyword3,
        /* GLSL */ `
        uniform float uTime;
        varying float vDirection;
        varying float vDistance;
        varying vec2 vUv;
        ${keyword3}`,
    );
    // 替换并添加到着色器
    const keyword4 = 'gl_FragColor.a *= step(vCounters, visibility);';
    shader.fragmentShader = shader.fragmentShader.replace(
        keyword4,
        /* GLSL */ `${keyword4}
        vec2 p;
        p.x = vUv.x * vDistance;
        p.y = vUv.y * 1.0 - 0.5;

        float centerDistY = p.y; // 距中心 Y 距离
        float offset = abs(centerDistY) * 0.5; // 控制对角线角度

        float time = uTime;
        // 更改中心上方和下方的对角线方向
        if(centerDistY < 0.0) {
            if(vDirection == 1.0){
                time = -uTime;
                offset = -offset;
            }else if(vDirection == 2.0) {
                offset = offset;
            }
        }

        // 使用 mod 函数和基于距中心 y 距离的偏移生成线
        float line = mod(p.x - time + offset, 1.9) < 0.9 ? 1.0 : 0.0;
        vec3 mainColor;

        // 根据方向改变颜色
        if(vDirection == 1.0) {
            mainColor = vec3(0.0, 1.0, 1.0);
        } else if(vDirection == 2.0) {
            mainColor = vec3(1.0, 1.0, 0.0);
        }
        vec3 color = mix(mainColor, mainColor, line);

        gl_FragColor = vec4(color, line * 0.7);
        `,
    );
};
然后将其添加到createLink函数中。为了匹配每条 MeshLine 的 UV 坐标的长宽比,获取该线的两点之间的距离,并将名为 uDirection 的属性变量传递给着色器。此外,有关连接线数据方向的信息也会使用名为 uDirection 的属性变量传递到着色器。我添加了一个名为 uTime 的uniform变量来制作动画。
               // 计算两点之间的距离
               const distance = point.distanceTo(points[index + 1]);

               // 获取MeshLine的顶点数
               const numVerticesAfter = line.geometry.getAttribute('position').count;

               // 根据顶点数量生成距离数组,并使用 setAttribute 添加顶点属性,用于计算UV坐标的纵横比
               const distances = new Float32Array(numVerticesAfter).fill(distance);
               line.setAttribute('uDistance', new THREE.BufferAttribute(distances, 1));

               // 根据顶点数量生成方向数组,并使用 setAttribute 添加顶点属性,代表连接线数据的方向
               const directions = new Float32Array(numVerticesAfter).fill(feature.properties.direction);
               line.setAttribute('uDirection', new THREE.BufferAttribute(directions, 1));
                // 将uTime(时间)添加到uniforms 变量中,用于动画
               Object.assign(linkMaterial.userData, {
                   uniforms: {
                       uTime: { value: 0 },
                   },
               });
接下来,在animate函数中编写添加到uTime的过程。
   // 行人网络动画
   if (linkMaterial.uniforms.uTime) {
       linkMaterial.uniforms.uTime.value += 0.1;
   }