之前写了一篇文章说明了MATLAB图例可以自己diy,这次又有了diy的机会,我开发了一个简单的小工具,能够实现绘制伪3d的柱状图,大概效果如下:

使用说明
由于涉及的代码比较接近MATLAB底层的图形对象,有点东西还是没倒腾明白,目前使用起来还是有以下几个点要注意:
- 如果是R2024a版本,绘制结束后请勿大幅度改变画布大小,否则图例会被刷掉(因此也最好在最后使用工具函数),应该会需要通过
addlistener解决但目前还未完成倒腾出来,R2024a之前版本不会出这个Bug(属实是不知道新版本改了什么地方引起的这个Bug) - 请使用至少R2019b版本,以前版本柱状图会缺一点属性
- 柱状图请绘制在最下方(为了使最新版也能顺利使用用了一些不得已的手段,导致柱状图必须绘制在最下方)
另外本文中一部分图片使用了SAxes这个函数美化了一下,这个函数长这样:
function SAxes
ax               = gca;
ax.NextPlot      = 'add';
ax.Box           = 'on';
ax.XGrid         = 'on';
ax.YGrid         = 'on';
ax.XMinorTick    = 'on';
ax.YMinorTick    = 'on';
ax.LineWidth     = .8;
ax.GridLineStyle = '-.';
ax.FontSize      = 13;
ax.FontName      = 'Times New Roman';
ax.GridAlpha     = .05;
% ax.TickDir       = 'out';
end
伪3d柱状图工具放在文末,现在先来讲解一下用法:
使用教程
1 基本使用
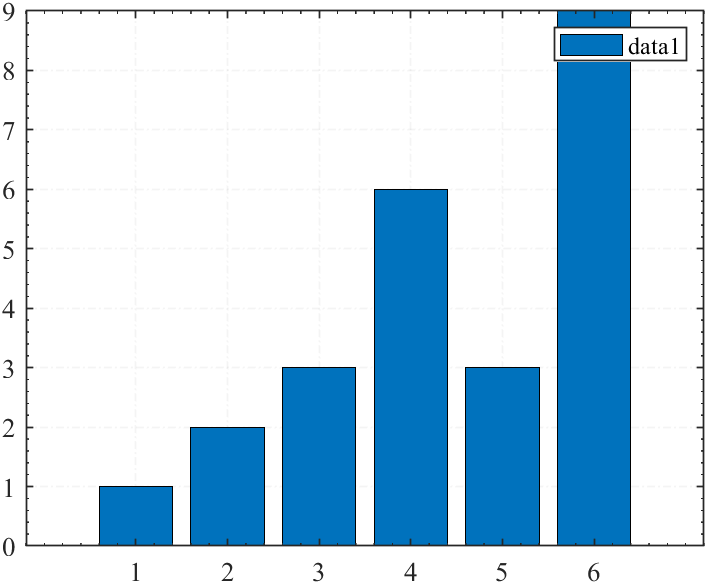
假如绘制了柱状图:
y = [1 2 3 6 3 9];
bHdl = bar(y);

legend()
SAxes()
只需要在最后面简单加上一行代码,变成:
y = [1 2 3 6 3 9];
bHdl = bar(y);

legend()
SAxes()

bar2_5D(bHdl, 'w')
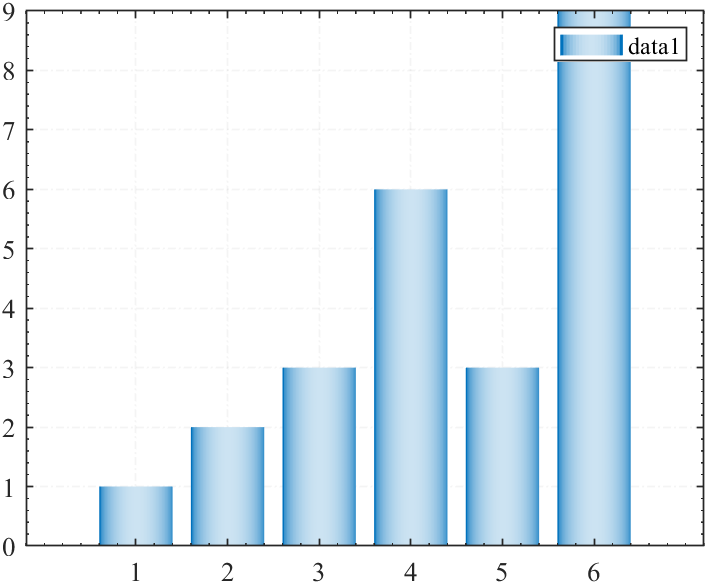
就是打光风格的,如果第二个参数是k就是阴影风格的:
bar2_5D(bHdl, 'k')

2 支持的柱状图格式
基本上所有类型柱状图均可支持:
y = [2 2 3; 2 5 6; 2 8 9; 2 11 12];

figure('Units','normalized', 'Position',[.1,.1,.6,.7]);
bHdl = bar(y);
legend()
SAxes()
bar2_5D(bHdl, 'w')


figure('Units','normalized', 'Position',[.1,.1,.6,.7]);
bHdl = bar(y, 'stacked');
legend()
SAxes()
bar2_5D(bHdl, 'w')


figure('Units','normalized', 'Position',[.1,.1,.6,.7]);
bHdl = barh(y);
legend()
SAxes()
bar2_5D(bHdl, 'w')


figure('Units','normalized', 'Position',[.1,.1,.6,.7]);
bHdl = barh(y, 'stacked');
legend()
SAxes()
bar2_5D(bHdl, 'w')


3 更换颜色
y = [2 2 3; 2 5 6; 2 8 9; 2 11 12];

CList = [133,131,169; 202,139,168; 160,189,213]./255;
barHdl = barh(y);
for i = 1:length(barHdl)
    barHdl(i).FaceColor = CList(i,:);
end

legend({'A','B','C'}, 'FontSize',13);
SAxes()
bar2_5D(barHdl, 'k')

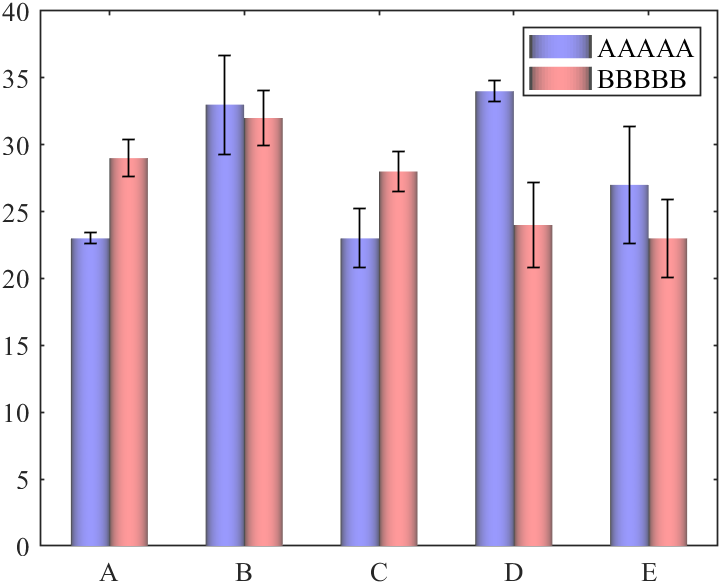
4 有误差棒示例
rng(5)
Data = randi([20,35], [5,2]);
err = rand([5,2]).*5;

hold on
barHdl = bar(Data,'BarWidth',1);
% 修改柱状图颜色透明度
barHdl(1).FaceColor = [153,153,253]./255;
barHdl(2).FaceColor = [255,153,154]./255;

% 修饰柱状图并绘制图例
lgd = legend({'AAAAA','BBBBB'}, 'FontSize',13, 'FontName','Times New Roman');
bar2_5D(barHdl, 'w')

% 绘制并修饰误差棒
errorbar(barHdl(1).XEndPoints,Data(:,1),err(:,1), 'LineStyle','none', 'Color','k', 'LineWidth',.8);
errorbar(barHdl(2).XEndPoints,Data(:,2),err(:,2), 'LineStyle','none', 'Color','k', 'LineWidth',.8);
% 坐标区域修饰,修改X轴标签
ax            = gca;
ax.YLim       = [0,40];
ax.LineWidth  = .8;
ax.TickLength = [.005,.001];
ax.Box        = 'on';
ax.XTick      = 1:5;
ax.XTickLabel = {'A','B','C','D','E'};
ax.FontSize   = 13;
ax.FontName   = 'Times New Roman';
5 有区域高亮示例
y = [2 2; 3 2; 5 6; 2 8; 9 2; 11 12];
barHdl = bar(y);
CList = [87,87,213; 138,213,95]./255;
for i = 1:length(barHdl)
    barHdl(i).FaceColor = CList(i,:);
end

legend()
set(gca, 'XLim',[.5,6.5])
SAxes()
bar2_5D(barHdl, 'w')

xregion([.5,3.5], 'FaceColor',[233,241,254]./255)
xregion([3.5,6.5], 'FaceColor',[251,244,218]./255)

若是把工具函数调用放在最后,就能显示全部图例:
y = [2 2; 3 2; 5 6; 2 8; 9 2; 11 12];
barHdl = bar(y);
CList = [87,87,213; 138,213,95]./255;
for i = 1:length(barHdl)
    barHdl(i).FaceColor = CList(i,:);
end

legend()
set(gca, 'XLim',[.5,6.5])
SAxes()


xregion([.5,3.5], 'FaceColor',[233,241,254]./255)
xregion([3.5,6.5], 'FaceColor',[251,244,218]./255)

bar2_5D(barHdl, 'w')

工具函数完整代码
function bar2_5D(barHdl, style)
% Copyright (c) 2024, Zhaoxu Liu / slandarer
hold on
CCC = @(x, C1, C2) C2.*sqrt(1 - x.^2) + C1.*(1 - sqrt(1 - x.^2));
Ver = version; Ver = str2double(Ver(1:2));
GraphicsNum = length(get(gca, 'Children')) - length(barHdl);

if nargin < 2
    style = 'w';
end

% 基础属性计算
if Ver < 24
    GroupWidth = 2/3;
else
    GroupWidth = barHdl(1).GroupWidth;
end
if length(barHdl) > 1 && ~strcmp(barHdl(1).BarLayout, 'stacked')
    BarWidth = GroupWidth.*barHdl(1).BarWidth./length(barHdl);
else
    BarWidth = barHdl(1).BarWidth;
end


% 柱状图上色
[XMesh, YMesh] = meshgrid(linspace(0,1,50));
XMesh = 2.*XMesh - 1;
for i = 1:length(barHdl)
    barHdl(i).EdgeColor = 'none';

    for j = 1:length(barHdl(i).XEndPoints)
        C = barHdl(i).CData(1,:);
        if strcmp(style, 'w')
            CMesh = cat(3, CCC(XMesh, C(1), .8 + C(1)*.2), ...
                           CCC(XMesh, C(2), .8 + C(2)*.2), ...
                           CCC(XMesh, C(3), .8 + C(3)*.2));
        else
            CMesh = cat(3, CCC(XMesh, .3, C(1)), ...
                           CCC(XMesh, .3, C(2)), ...
                           CCC(XMesh, .3, C(3)));
        end
        if strcmp(barHdl(1).Horizontal, 'on')
            tY = XMesh.*BarWidth./2 + barHdl(i).XEndPoints(j);
            tX = YMesh.*barHdl(i).YData(j) + barHdl(i).YEndPoints(j) - barHdl(i).YData(j);
        else
            tX = XMesh.*BarWidth./2 + barHdl(i).XEndPoints(j);
            tY = YMesh.*barHdl(i).YData(j) + barHdl(i).YEndPoints(j) - barHdl(i).YData(j);
        end
        surfHdl = surf(tX, ...
                       tY, XMesh.*0, ...
                       'CData',CMesh, 'EdgeColor','none');
        surfHdl.Annotation.LegendInformation.IconDisplayStyle = 'off';
        barHdl(i).Annotation.LegendInformation.IconDisplayStyle = 'off';
        % uistack(surfHdl, 'bottom'); % uistack(barHdl(i), 'bottom')
    end
end

for i = 1:length(barHdl), plot([1,1],[1,1], 'Color',barHdl(i).CData(1,:), 'DisplayName',barHdl(i).DisplayName); end
lgdHdl = get(gca, 'Legend');


if ~isempty(lgdHdl)
pause(1e-6)

% 获取图例图标
% lgdEntryChild = lgdHdl.EntryContainer.NodeChildren;
% iconSet = arrayfun(@(lgdEntryChild)lgdEntryChild.Icon.Transform.Children.Children, lgdEntryChild, UniformOutput = false)
childrenList = get(gca, 'Children');
for i = 1:GraphicsNum
    uistack(childrenList(end-length(barHdl)+1-i), 'top');
end
pause(1e-6)
lgdEntryChild = lgdHdl.EntryContainer.NodeChildren;
iconSet = arrayfun(@(lgdEntryChild)lgdEntryChild.Icon.Transform.Children.Children, lgdEntryChild, UniformOutput = false);

XX = [0,1,1,0]; YY = [1,1,0,0];
% 替换图例图标
for j = 1:20
    newFaceHdl = matlab.graphics.primitive.world.Quadrilateral();
    newFaceHdl.PickableParts = 'all';
    newFaceHdl.Layer = 'middle';
    newFaceHdl.ColorBinding = 'object';
    newFaceHdl.ColorType = 'truecoloralpha';
    newFaceHdl.VertexData = single([XX./20 + (j-1)/20; YY; XX.*0]);
    for i = 1:length(barHdl)
        oriEdgeHdl = iconSet{end + 1 - i};
        tNewFaceHdl = copy(newFaceHdl);
        C = oriEdgeHdl.ColorData;
        if strcmp(style, 'w')
            tNewFaceHdl.ColorData = uint8([CCC((j-1)/19*2-1, double(C(1)), 204 + double(C(1)).*.2); ...
                                           CCC((j-1)/19*2-1, double(C(2)), 204 + double(C(2)).*.2); ...
                                           CCC((j-1)/19*2-1, double(C(3)), 204 + double(C(3)).*.2); 255]);
        else
            tNewFaceHdl.ColorData = uint8([CCC((j-1)/19*2-1, 76.5, double(C(1))); ...
                                           CCC((j-1)/19*2-1, 76.5, double(C(2))); ...
                                           CCC((j-1)/19*2-1, 76.5, double(C(3))); 255]);
        end
        tNewFaceHdl.Parent = oriEdgeHdl.Parent;
    end
end
for i = 1:length(barHdl)
    oriEdgeHdl = iconSet{end + 1 - i};
    oriEdgeHdl.Visible = 'off';
end
lgdHdl.AutoUpdate = 'off';
end
end


