Original research: Tumor microenvironment evaluation promotes precise checkpoint immunotherapy of advanced gastric cancer - PMC (nih.gov)
补充文件位置:https://www.ncbi.nlm.nih.gov/pmc/articles/PMC8356190/bin/jitc-2021-002467supp001.xlsx
原图

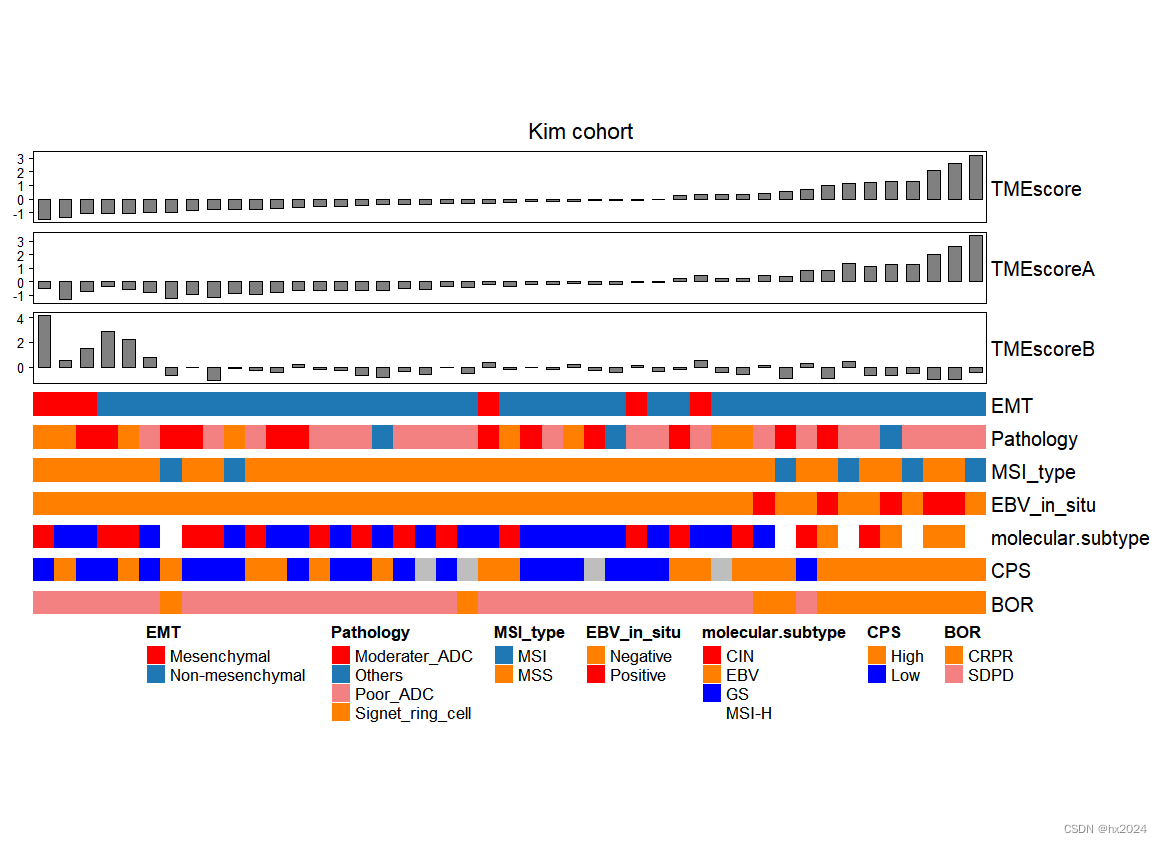
该图展示了样本的评分变化和相关的临床信息变化。
对每个转移性胃癌患者(列)进行临床病理特征和分子特征注释。列注释表示上皮-间充质转化 (EMT)(间充质、非间充质);组织学(中度腺癌 (ADC)、ADC 差、印环细胞等);MSI 状态(MSS、MSI);EBV状态(阴性、阳性);分子亚型(染色体不稳定性(CIN)、EBV、基因组稳定(GS)、MSI-H);程序性死亡配体 1 综合阳性评分 (CPS)(高、低、NE);组织肿瘤突变负荷(tTMB);最佳总体反应 (BOR) (CR、PR、PD、SD);以及每个样本的二元 BOR(响应者、非响应者)。TMEscore、TMEscoreA 和 TMEscoreB 显示在面板顶部。高 TMEscore 能够识别 EBV 阳性和 MSI-H 患者以及免疫检查点阻断反应者。
复现
rm(list = ls())
library(ComplexHeatmap)
library(circlize)
data <- read.csv("data.csv")

#进行文献复现#
dat1 <- data[order(data$TMEscore),]#进行排序
dat1 <- as.data.frame(dat1)
#[1] "TMEscore"          "TMEscoreA"         "TMEscoreB"         "EMT"
#[5] "Pathology"         "MSI_type"          "EBV_in_situ"       "molecular.subtype"
#[9] "CPS"               "BOR"

#是否需要将数据转换为int??: 保留3位小数测试
ht_list <-  HeatmapAnnotation(TMEscore = anno_barplot(dat1$TMEscore, height = unit(1.5, "cm"))) %v%
  HeatmapAnnotation(TMEscoreA = anno_barplot(dat1$TMEscoreA, height = unit(1.5, "cm"))) %v%
  HeatmapAnnotation(TMEscoreB = anno_barplot(dat1$TMEscoreB, height = unit(1.5, "cm")))  %v%
  HeatmapAnnotation(EMT = dat1$EMT,
                  col = list(EMT = c("Mesenchymal" = "red", "Non-mesenchymal" = "#1f78b4")))%v%
  HeatmapAnnotation(Pathology = dat1$Pathology,
                    col = list(Pathology = c("Moderater_ADC" = "red","Others" = "#1f78b4",
                                             "Poor_ADC"="#f38181","Signet_ring_cell" = "#ff7f00")))%v%
  HeatmapAnnotation(MSI_type = dat1$MSI_type,
                    col = list(MSI_type = c("MSI" = "#1f78b4","MSS" = "#ff7f00")))%v%
  HeatmapAnnotation(EBV_in_situ = dat1$EBV_in_situ,
                    col = list(EBV_in_situ = c("Positive" = "red","Negative" = "#ff7f00")))%v%
  HeatmapAnnotation(molecular.subtype = dat1$molecular.subtype,
                    col = list(molecular.subtype = c("CIN" = "red","EBV" = "#ff7f00",
                                                     "GS" = "blue", "MSI-H" = "white")))%v%
  HeatmapAnnotation(CPS = dat1$CPS,
                    col = list(CPS = c("High" = "#ff7f00","Low" = "blue")))%v%
  HeatmapAnnotation(BOR = dat1$BOR,col = list(BOR = c("CRPR" = "#ff7f00","SDPD" = "#f38181")))

#绘图
draw(ht_list, column_title = "Kim cohort",
     merge_legends = TRUE, heatmap_legend_side = "bottom")
dev.off()
参考文献:
1:Tumor microenvironment evaluation promotes precise checkpoint immunotherapy of advanced gastric cancer


