大纲
1.概述
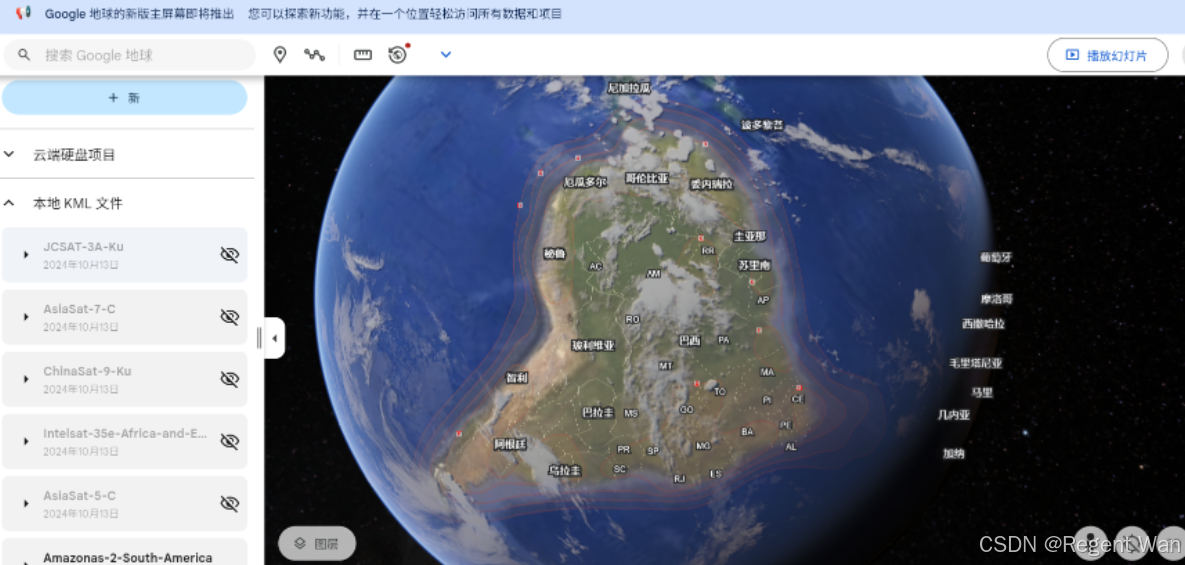
文件使用 KML(Keyhole Markup Language)格式,用于展示卫星在特定地区的波束覆盖情况,便于在地理信息系统(GIS)中进行可视化分析。
2.文件结构
-
文档基本信息
- 名称:
<name>标签定义了该 KML 文件的名称。
- 名称:
-
样式定义
- 定义了多个样式,以便在可视化中使用,包括:
- LineStyle:指定线条的颜色和宽度。
- PolyStyle:定义多边形的填充颜色和边界样式。
- IconStyle:为波束的定位点提供图标样式,具有正常和高亮状态。
- 定义了多个样式,以便在可视化中使用,包括:
-
数据标记(Placemark)
- 每个波束覆盖区域被标记为
<Placemark>,包括以下内容:- 位置点:使用
<Point>标签定义波束中心的经纬度坐标。 - 覆盖区域:使用
<Polygon>标签定义卫星的覆盖范围,包含以下属性:- tessellate:设置为
1,表示多边形与地形相贴合。 - extrude:设置为
1,使多边形从地面向上延伸。 - altitudeMode:设置为
clampedToGround,表示高度相对于地面。
- tessellate:设置为
- 位置点:使用
- 每个波束覆盖区域被标记为
3.覆盖区域详细信息
-
封闭区域Gain 53
- 样式 ID:
#colset_1 - 中心坐标:经度 48.8933,纬度 59.4004。
- 覆盖多边形坐标:
- 包括坐标
51.7574,60.0825和48.8934,59.4004,构成该波束的覆盖区域。
- 包括坐标
- 样式 ID:
-
封闭区域Gain 52
- 样式 ID:
#colset_2 - 中心坐标:经度 79.7535,纬度 62.6172。
- 覆盖多边形坐标:
- 一系列坐标形成复杂的多边形,确保详细覆盖区域的准确表示。
- 样式 ID:
4.应用场景
KML数据可广泛应用于以下领域:
- 通信网络分析:帮助通信运营商评估卫星信号覆盖效果,优化网络部署。
- 地理信息展示:提供直观的地理信息视图,支持决策过程。
- 科研支持:为研究人员提供卫星信号的空间分布数据,助力相关研究。
5.使用说明
- 加载文件:将该 KML 文件导入 Google Earth 或其他支持 KML 的 GIS 软件,或API支持读取kml数据的GIS 系统。
- 浏览数据:用户可通过软件查看卫星波束的覆盖区域及其信号强度。
- 进一步分析:根据覆盖区域数据进行深度分析,帮助优化卫星通信方案。
6.数据样例


<?xml version="1.0" encoding="UTF-8"?>
<kml xmlns="http://www.opengis.net/kml/2.2">
<Document>
<name>ABS-2A-Russia</name>
<Style id="colset_1">
<LineStyle>
<color>66143CA0</color>
<width>1</width>
</LineStyle>
<PolyStyle>
<color>150099FF</color>
<outline>1</outline>
<fill>1</fill>
</PolyStyle>
</Style>
<Style id="gainp_1n">
<IconStyle>
<scale>1</scale>
<Icon>
<href>https://genmap.lyngsat.org/data/kml_styles/2/numbers/53.png</href>
</Icon>
</IconStyle>
<LabelStyle>
<scale>0</scale>
</LabelStyle>
</Style>
<Style id="gainp_1h">
<IconStyle>
<scale>3</scale>
<Icon>
<href>https://genmap.lyngsat.org/data/kml_styles/2/numbers/53.png</href>
</Icon>
<StyleMap id="gainp_1">
<Pair>
<key>normal</key>
<styleUrl>#gainp_1n</styleUrl>
</Pair>
<Pair>
<key>highlight</key>
<styleUrl>#gainp_1h</styleUrl>
</Pair>
</StyleMap>
<Placemark>
<styleUrl>#gainp_1</styleUrl>
<Point>
<coordinates>48.893374777786,59.40035957324,0
</coordinates>
</Point>
</Placemark>
<Placemark>
<name>Gain 53</name>
<styleUrl>#colset_1</styleUrl>
<Polygon id="beam0">
<tessellate>1</tessellate>
<extrude>1</extrude>
<altitudeMode>clampedToGround</altitudeMode>
<outerBoundaryIs>
<LinearRing>
<coordinates>
51.757376841882,60.082543019589,0
48.893374777786,59.40035957324,0
</coordinates>
</LinearRing>
</outerBoundaryIs>
</Polygon>
</Placemark>
<Style id="colset_2">
<LineStyle>
<color>66143CA0</color>
<width>1</width>
</LineStyle>
<PolyStyle>
<color>150099FF</color>
<outline>1</outline>
<fill>1</fill>
</PolyStyle>
</Style>
<Style id="gainp_2n">
<IconStyle>
<scale>1</scale>
<Icon>
<href>https://genmap.lyngsat.org/data/kml_styles/2/numbers/52.png</href>
</Icon>
</IconStyle>
<LabelStyle>
<scale>0</scale>
</LabelStyle>
</Style>
<Style id="gainp_2h">
<IconStyle>
<scale>3</scale>
<Icon>
<href>https://genmap.lyngsat.org/data/kml_styles/2/numbers/52.png</href>
</Icon>
</IconStyle>
<LabelStyle>
<scale>0</scale>
</LabelStyle>
</Style>
<StyleMap id="gainp_2">
<Pair>
<key>normal</key>
<styleUrl>#gainp_2n</styleUrl>
</Pair>
<Pair>
<key>highlight</key>
<styleUrl>#gainp_2h</styleUrl>
</Pair>
</StyleMap>
<Placemark>
<styleUrl>#gainp_2</styleUrl>
<Point>
<coordinates>79.753527821831,62.617240813598,0
</coordinates>
</Point>
</Placemark>
<Placemark>
<name>Gain 52</name>
<styleUrl>#colset_2</styleUrl>
<Polygon id="beam1">
<tessellate>1</tessellate>
<extrude>1</extrude>
<altitudeMode>clampedToGround</altitudeMode>
<outerBoundaryIs>
<LinearRing>
<coordinates>
92.067382941176,63.256424376227,0
84.471396652292,62.75290828734,0
79.753527821831,62.617240813598,0
73.6321272706,62.344869696391,0
67.551078224651,62.335282703022,0
59.975150279382,62.341317697459,0
</coordinates>
</LinearRing>
</outerBoundaryIs>
</Polygon>
</Placemark>
</Document>
</kml>
7.结语
该批KML 文件为多卫星提供了一个详细的覆盖图,能够有效支持通信网络的规划和管理。通过该文件,用户能够清晰地了解卫星信号覆盖的地理范围和强度,为后续的应用和研究提供了重要的数据基础。目前有该批数据近400个kml文件,如需要此数据可在后台与我联系获取。


