Prometheus监控Nginx服务

一、检查Nginx模块
- 监控Nginx需要安装nginx-module-vts
模块,nginx-vts-exporter`就是用来采集Ngin文章来源(Source):浅时光博客x的一些指标数据
1、检查已安装模块
- RPM包安装的nginx
nginx -V
- 编译安装的Nginx需要到安装路径下执行
nginx -V命令。例如
/usr/local/nginx/sbin/nginx -V
2、安装vts模块
2.1:编译安装模块
- 项目地址:GitHub
- 对应的Nginx兼容版本

#下载模块源码进行编译添加,注意进行编译是进入到nginx压缩包解压后的目录,不是nginx编译好的安装目录
[root@nginx ~]# cd nginx-1.20.0
[root@nginx nginx-1.20.0]# git clone git://github.com/vozlt/nginx-module-vts.git

#特别注意添加新模块时,之前已经添加的模块也必须添加进去一块执行命令
[root@nginx nginx-1.20.0]# ./configure --prefix=/usr/local/nginx --user=nginx --group=nginx --add-module=/root/nginx-1.20.0/nginx-module-vts/

#执行编译
[root@nginx nginx-1.20.0]# make

#特别注意:千万不要执行make install,如果是已经运行的nginx执行了make install则会把当前的nginx配置全部给覆盖掉


#备份原来的nginx可执行文件
[root@nginx nginx-1.20.0]# cp /usr/local/nginx/sbin/nginx /usr/local/nginx/sbin/nginx.bak

#将编译好的nginx复制到原始nginx的sbin目录
执行这条命令,可能会报以下异常,提示文件被占用:
cp objs/nginx /usr/local/nginx/sbin/nginx
cp: cannot create regular file ‘/usr/local/nginx/sbin/nginx’: Text file busy

#可以使用以下命令进行强制覆盖:
[root@nginx nginx-1.20.0]# cp -rfp objs/nginx /usr/local/nginx/sbin/nginx

#再执行/usr/local/nginx/sbin/nginx -V查看一下nginx的模块情况
[root@nginx nginx-1.20.0]# /usr/local/nginx/sbin/nginx -V

2.2:平滑切换新版
2.2.1:启动新版主进程
- 命令:
kill -USR2旧版本的Nginx主进程号
[root@nginx ~]# ps -ef|grep nginx | grep master
root     16107     1  0 Oct29 ?        00:00:00 nginx: master process /usr/local/nginx/sbin/nginx -c /usr/local/nginx/conf/nginx.conf

[root@nginx ~]# kill -USR2 16107
[root@nginx ~]# ps -ef|grep nginx | grep master
- 旧版本Nginx主进程接收到
-USR2信号,将重命名它的.pid文件为.oldpid,然后执行新版本的Nginx可执行程序,依次启动新版本的主进程和工作进程
2.2.2:关闭旧版从容器的工作进程
- 命令:
kill -WINCH旧版本的Nginx主进程号
[root@nginx ~]# kill -WINCH 16107
二、添加Nginx配置
1、添加配置
[root@nginx nginx-1.20.0]# vim /usr/local/nginx/conf/nginx.conf
http {
    vhost_traffic_status_zone;
    vhost_traffic_status_filter_by_host on;

    server {
        listen 30080;
        server_name 192.168.66.68;
        location /status {
            vhost_traffic_status_display;
            vhost_traffic_status_display_format html;
        }
}

}

#重载配置
[root@nginx nginx-1.20.0]# nginx -t
[root@nginx nginx-1.20.0]# nginx -s reload
2、单独配置
- 有可能export自带的默认参数不符合我们的要求,那我们可以在单独的server的上下文中添加如下的配置
server {
    listen      80;
    server_name kibana.xxx.com;

    vhost_traffic_status_filter_by_set_key $uri uri::$server_name;                       #每个uri访问量
    vhost_traffic_status_filter_by_set_key $geoip_country_code country::$server_name;    #不同国家/区域请求量
    vhost_traffic_status_filter_by_set_key $status $server_name;                         #http code统计
    vhost_traffic_status_filter_by_set_key $upstream_addr upstream::backend;             #后端转发统计
    vhost_traffic_status_filter_by_set_key $remote_port client::ports::$server_name;     #请求端口统计
vhost_traffic_status_filter_by_set_key $remote_addr client::addr::$server_name;          #请求IP统计

    location / {
	root index index.htm index.html;
    }
}
3、访问检测
- 现在通过浏览器,访问192.168.3.61:30080/status

三、安装Export
1、下载部署
- 项目地址:https://github.com/hnlq715/nginx-vts-exporter/tree/v0.10.3
- 在需要被监控的Nginx服务器上,下载并上传
Nginx exporter
wget https://github.com/hnlq715/nginx-vts-exporter/releases/download/v0.10.3/nginx-vts-exporter-0.10.3.linux-amd64.tar.gz

tar -zxvf nginx-vts-exporter-0.10.3.linux-amd64.tar.gz -C /usr/local/

cd /usr/local/
mv nginx-vts-exporter-0.10.3.linux-amd64 nginx-vts-exporter
2、启动服务
vim /usr/lib/systemd/system/nginx-vts-exporter.service
[Unit]
Description=prometheus_nginx_vts
After=network.target

[Service]
Type=simple
ExecStart=/usr/local/nginx-vts-exporter/nginx-vts-exporter  -nginx.scrape_uri http://192.168.66.68:30080/status/format/json
Restart=on-failure

[Install]
WantedBy=multi-user.target


systemctl daemon-reload
systemctl enable  nginx-vts-exporter.service
systemctl start  nginx-vts-exporter.service
systemctl status  nginx-vts-exporter.service
3、查看指标
- 输入IP+端口9913后面跟/me文章来源(Source):浅时光博客trics
四、配置Prometheus
#添加Nginx-vts-export相关监控配置
[root@prometheus ~]# vim /usr/local/prometheus/prometheus.yml
  ## Nginx监控
  - job_name: 'nginx'
    scrape_interval: 30s
    static_configs:
      - targets: ['192.168.66.68:9913']
    relabel_configs:
      - source_labels: [__address__]
        regex: '(.*)\:9913'
        target_label: 'hostname'
        replacement: '$1'
      - source_labels: [__address__]
        regex: '(.*)\:9913'
        target_label: 'nodeip'
        replacement: '$1'
#检查配置是否正确
[root@prometheus ~]# promtool check config /usr/local/prometheus/prometheus.yml

#重载prometheus配置
[root@prometheus ~]# curl -X POST http://127.0.0.1:9090/-/reload
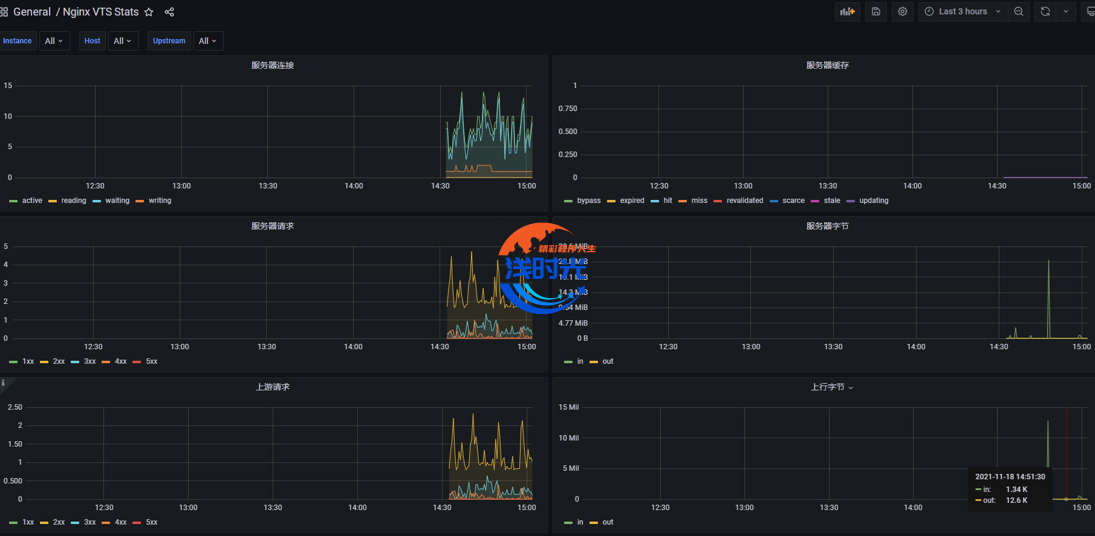
五、导入Grafana模板
Grafana模板下载
9090/-/reload
## 五、导入Grafana模板
------
[Grafana模板](https://www.dqzboy.com/go.php?url=https://grafana.com/grafana/dashboards/2949)[下载](https://www.dqzboy.com/go.php?url=https://grafana.com/grafana/dashboards/2949)
[](https://www.dqzboy.com/wp-content/uploads/2021/12/1638973677-b76f88fc9edbe9f.jpg)
