openvino系列 4. 图像分割基本案例
这里介绍一个基本的图像分割的例子,其实不管是图像分割还是物体检测,都基本遵循下面三个步骤:
- 首先,我们需要读取模型(
ie.read_model)并且编译(ie.compile_model); - 第二步,我们读取图片,并且reshape其大小以符合模型的输入;
- 第三部,模型推理(
compiled_model([input_image])[output_layer_ir])。得到的结果的尺寸和模型的输出尺寸相符。
环境描述:
- 本案例运行环境:Win10
- IDE:VSCode
- openvino版本:2022.1
- 代码链接,
2-basic-segmentation-detection-example
文章目录
1 图像分割
这里介绍如何使用OpenVINO进行图像分割。
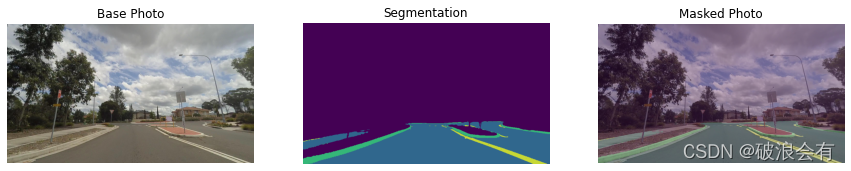
我们使用来自 Open Model Zoo 的预训练模型 road-segmentation-adas-0001。该模型识别四类:背景、道路、路缘和标记。
- 首先,我们需要读取模型(
ie.read_model)并且编译(ie.compile_model); - 第二步,我们读取图片,并且reshape其大小以符合模型的输入;
- 第三部,模型推理(
compiled_model([input_image])[output_layer_ir])。得到的结果的尺寸和模型的输出尺寸相符。
代码如下:
import cv2
import matplotlib.pyplot as plt
import numpy as np
import sys
from openvino.runtime import Core

print("1 Load the model.")
ie = Core()
model = ie.read_model(model="model/road-segmentation-adas-0001.xml")
compiled_model = ie.compile_model(model=model, device_name="CPU")
input_layer_ir = compiled_model.input(0)
output_layer_ir = compiled_model.output(0)
print("- Input layer info: {}".format(input_layer_ir))
print("- Output layer info: {}".format(output_layer_ir))
print("2 Load the image, and reshape to the same size as model input.")
# The segmentation network expects images in BGR format
image = cv2.imread("data/empty_road_mapillary.jpg")
rgb_image = cv2.cvtColor(image, cv2.COLOR_BGR2RGB)
image_h, image_w, _ = image.shape
print("- Image original shape: {0}".format(image.shape))
# N,C,H,W = batch size, number of channels, height, width
N, C, H, W = input_layer_ir.shape
# OpenCV resize expects the destination size as (width, height)
resized_image = cv2.resize(image, (W, H))
# reshape to network input shape
input_image = np.expand_dims(
    resized_image.transpose(2, 0, 1), 0
)
print("- Image size reshape into: {0}".format(input_image.shape))
print("3 Inference.")
# Run the inference
result = compiled_model([input_image])[output_layer_ir]
print("- Shape of inference result: {0}".format(result.shape))
# Prepare data for visualization
segmentation_mask = np.argmax(result, axis=1)
print("- Shape of segmentation mask: {0}".format(segmentation_mask.shape))
plt.imshow(segmentation_mask.transpose(1, 2, 0))
Terminal打印如下:
1 Load the model.
- Input layer info: <ConstOutput: names[data] shape{1,3,512,896} type: f32>
- Output layer info: <ConstOutput: names[L0317_ReWeight, L0317_ReWeight_SoftMax] shape{1,4,512,896} type: f32>
2 Load the image, and reshape to the same size as model input.
- Image original shape: (1080, 1920, 3)
- Image size reshape into: (1, 3, 512, 896)
3 Inference.
- Shape of inference result: (1, 4, 512, 896)
- Shape of segmentation mask: (1, 512, 896)
最后,我们可以可视化图像分割之后的效果。代码如下:
def segmentation_map_to_image(
    result: np.ndarray, colormap: np.ndarray, remove_holes: bool = False
) -> np.ndarray:
    """
    Convert network result of floating point numbers to an RGB image with
    integer values from 0-255 by applying a colormap.

    :param result: A single network result after converting to pixel values in H,W or 1,H,W shape.
    :param colormap: A numpy array of shape (num_classes, 3) with an RGB value per class.
    :param remove_holes: If True, remove holes in the segmentation result.
    :return: An RGB image where each pixel is an int8 value according to colormap.
    """
    if len(result.shape) != 2 and result.shape[0] != 1:
        raise ValueError(
            f"Expected result with shape (H,W) or (1,H,W), got result with shape {result.shape}"
        )

    if len(np.unique(result)) > colormap.shape[0]:
        raise ValueError(
            f"Expected max {colormap[0]} classes in result, got {len(np.unique(result))} "
            "different output values. Please make sure to convert the network output to "
            "pixel values before calling this function."
        )
        # reshape result from [1,H,W] to [H,W]
    elif result.shape[0] == 1:
        result = result.squeeze(0)
    result = result.astype(np.uint8)
    contour_mode = cv2.RETR_EXTERNAL if remove_holes else cv2.RETR_TREE
    mask = np.zeros((result.shape[0], result.shape[1], 3), dtype=np.uint8)
    for label_index, color in enumerate(colormap):
        label_index_map = result == label_index
        label_index_map = label_index_map.astype(np.uint8) * 255
        contours, hierarchies = cv2.findContours(
            label_index_map, contour_mode, cv2.CHAIN_APPROX_SIMPLE
        )
        cv2.drawContours(
            mask,
            contours,
            contourIdx=-1,
            color=color.tolist(),
            thickness=cv2.FILLED,
        )

    return mask

# Define colormap, each color represents a class
colormap = np.array([[68, 1, 84], [48, 103, 141], [53, 183, 120], [199, 216, 52]])
# Define the transparency of the segmentation mask on the photo
alpha = 0.3
# Use function from notebook_utils.py to transform mask to an RGB image
mask = segmentation_map_to_image(segmentation_mask, colormap)
resized_mask = cv2.resize(mask, (image_w, image_h))
# Create image with mask put on
image_with_mask = cv2.addWeighted(resized_mask, alpha, rgb_image, 1 - alpha, 0)
# Define titles with images
data = {"Base Photo": rgb_image, "Segmentation": mask, "Masked Photo": image_with_mask}
# Create subplot to visualize images
fig, axs = plt.subplots(1, len(data.items()), figsize=(15, 10))
# Fill subplot
for ax, (name, image) in zip(axs, data.items()):
    ax.axis('off')
    ax.set_title(name)
    ax.imshow(image)
# Display image
plt.show(fig)